PhD Mentorship and
Gender Representation in
Academic Mathematics
CU Boulder Applied Math Seminar
April 16th, 2026
Also: aikido, hiking, cycling, tea, chess, gardening, reading, cats


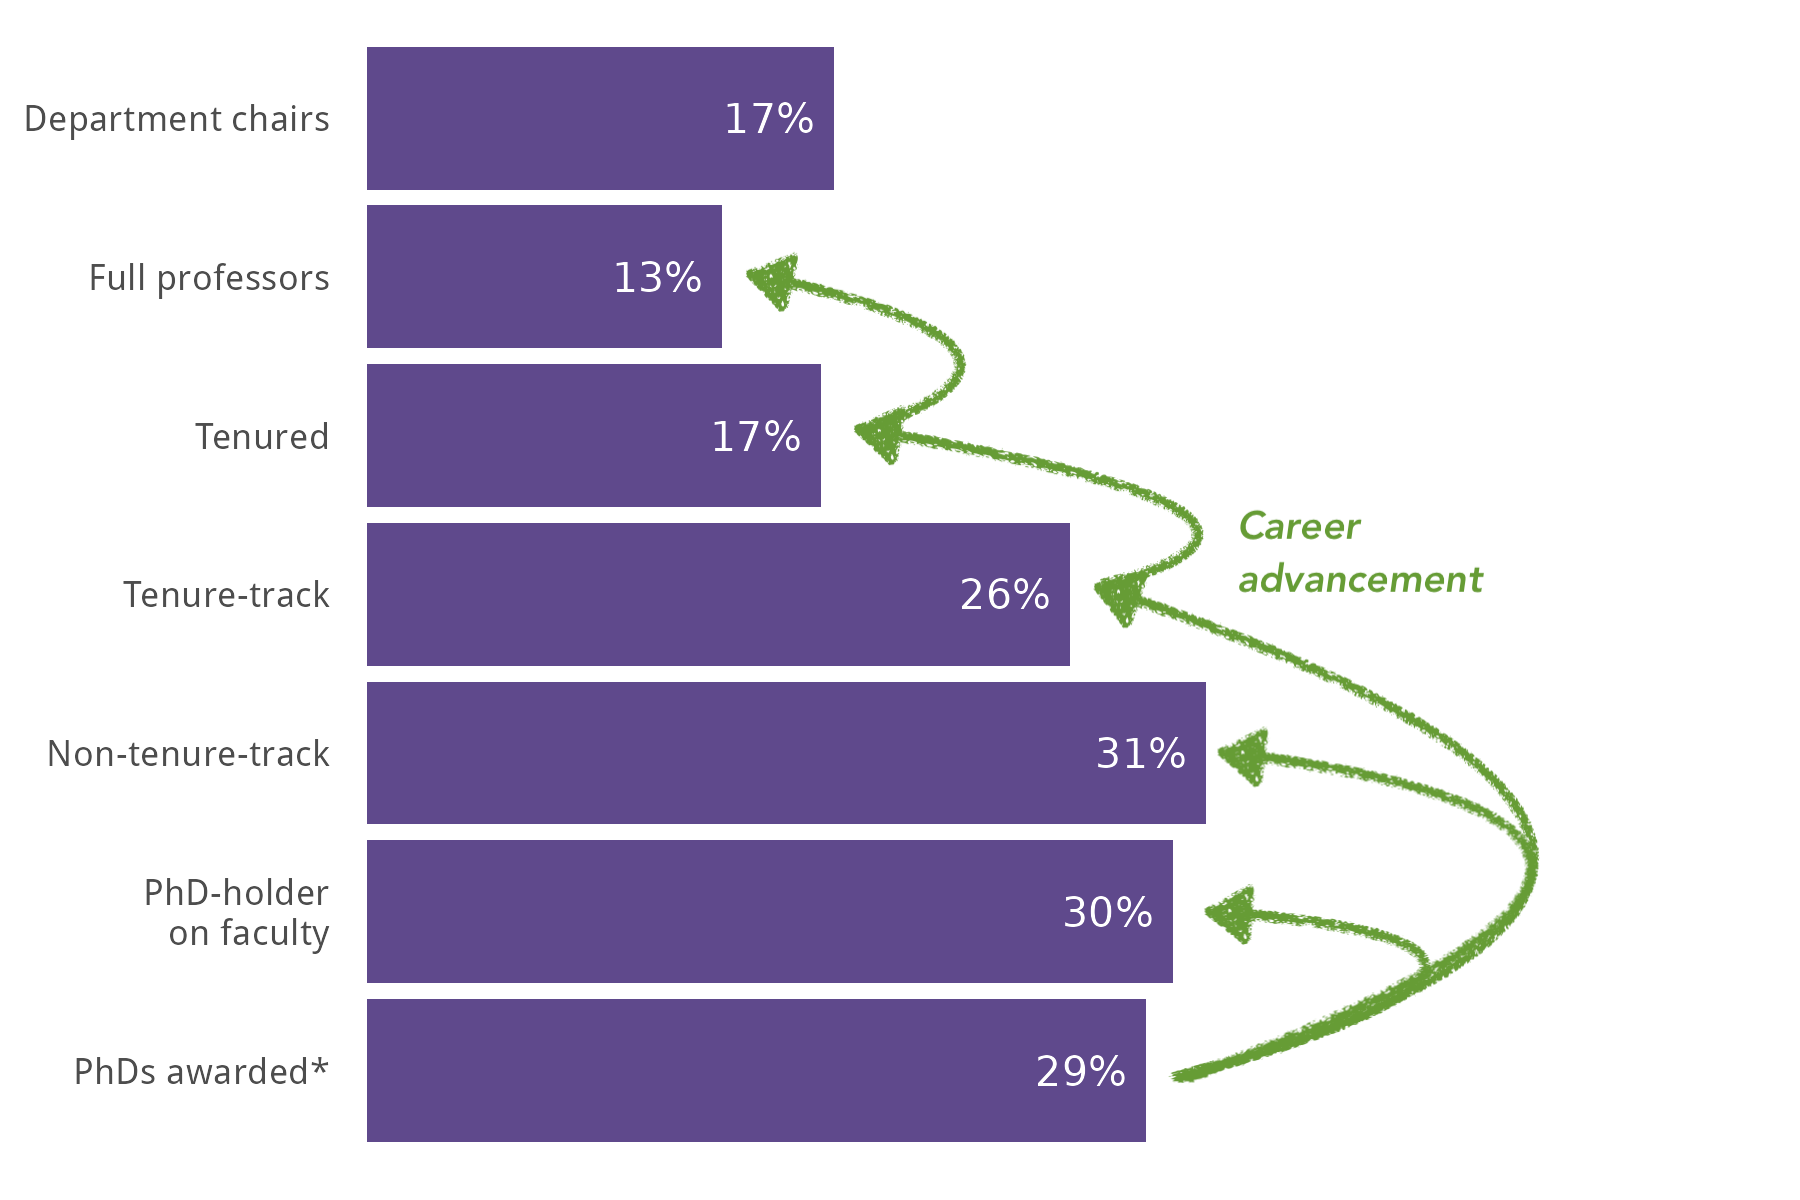
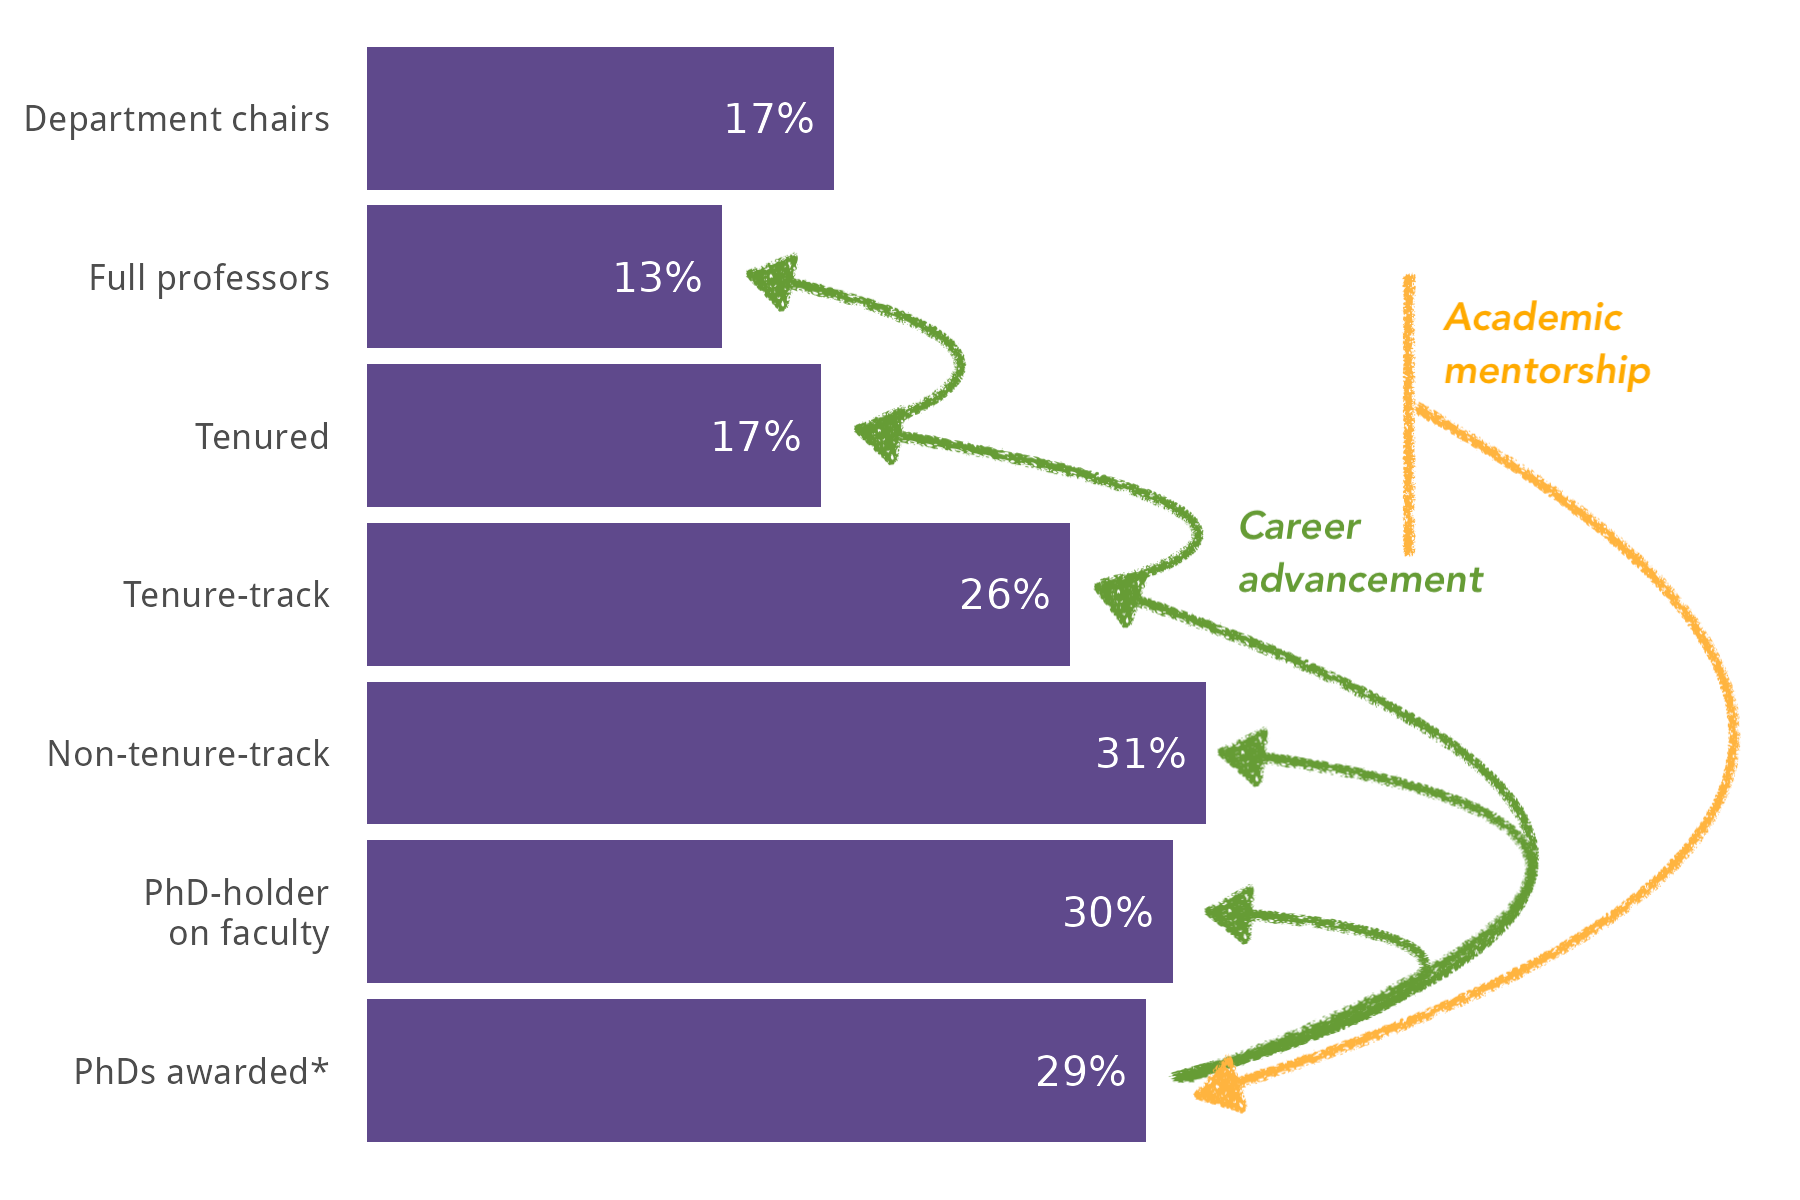
Gender Representation in Academic Math
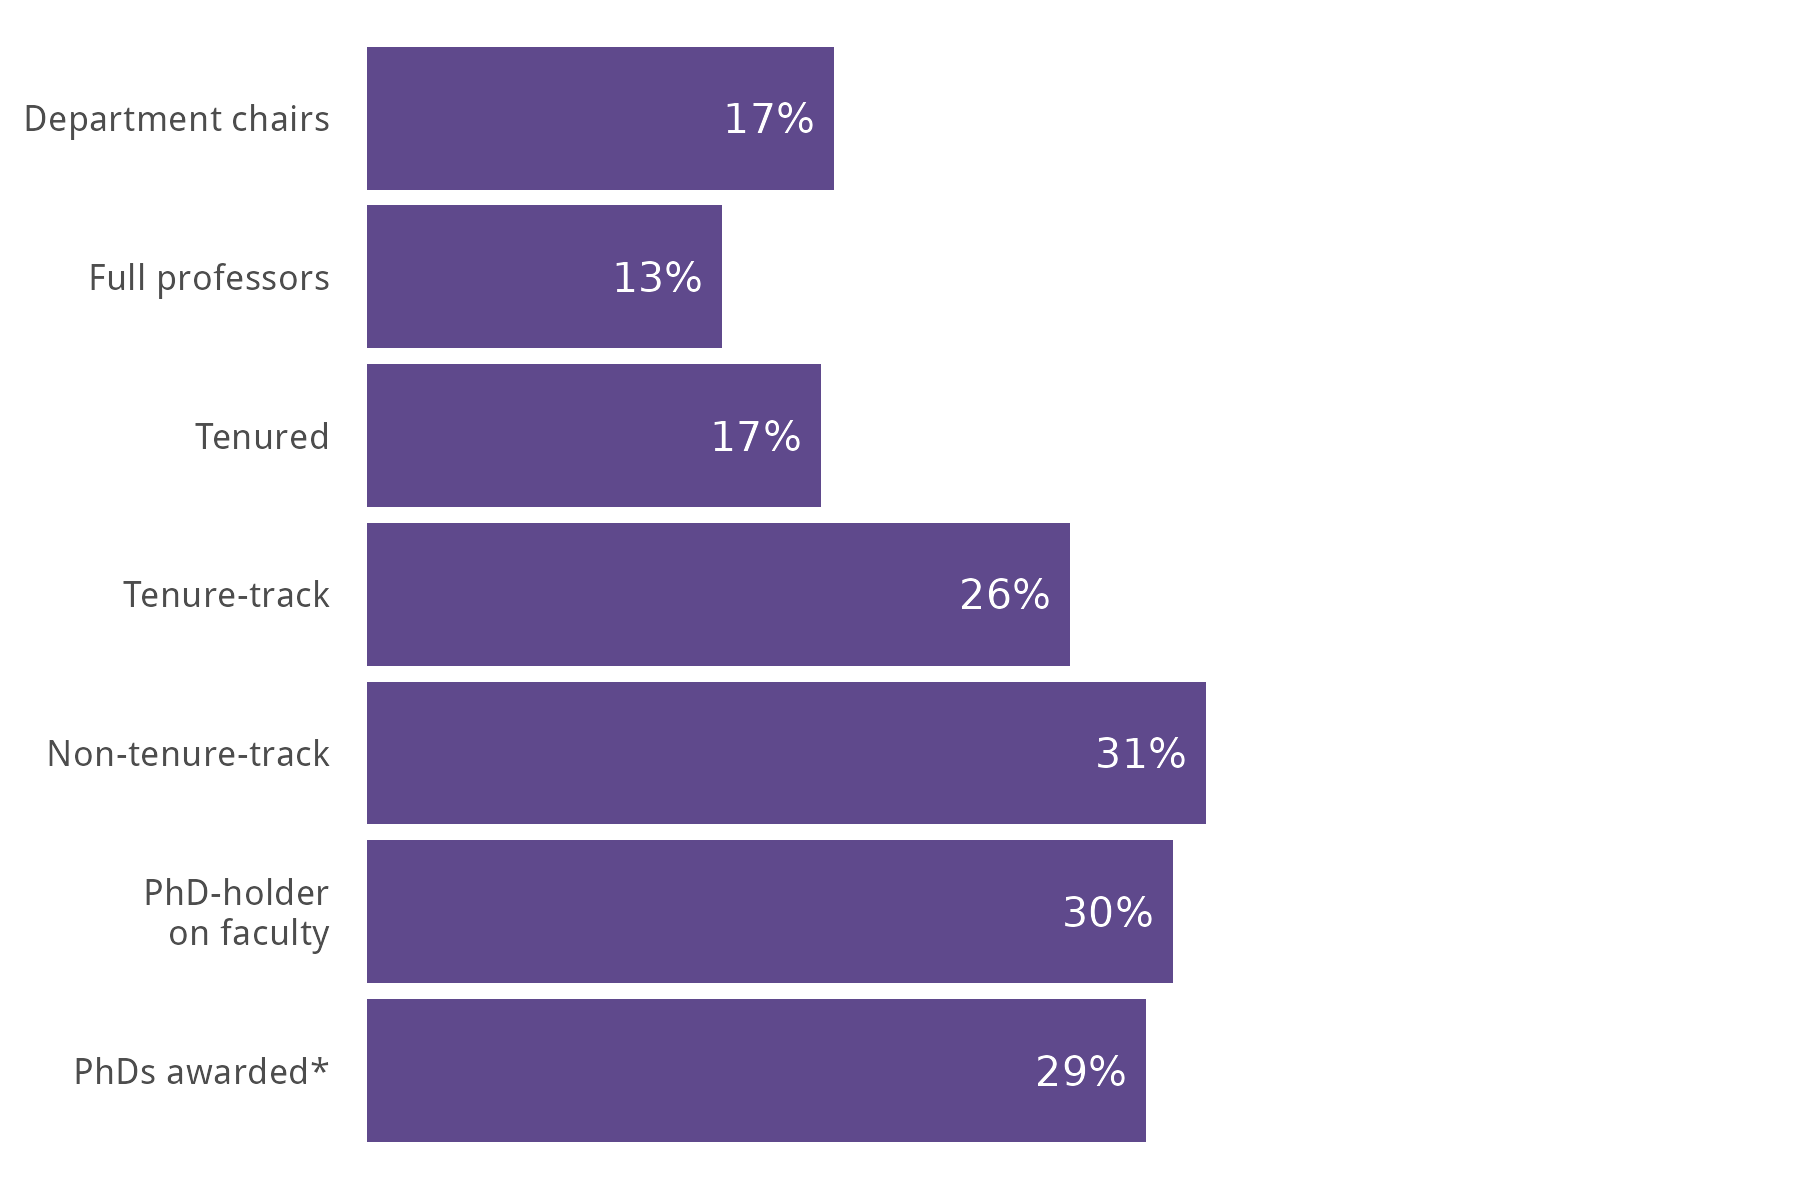
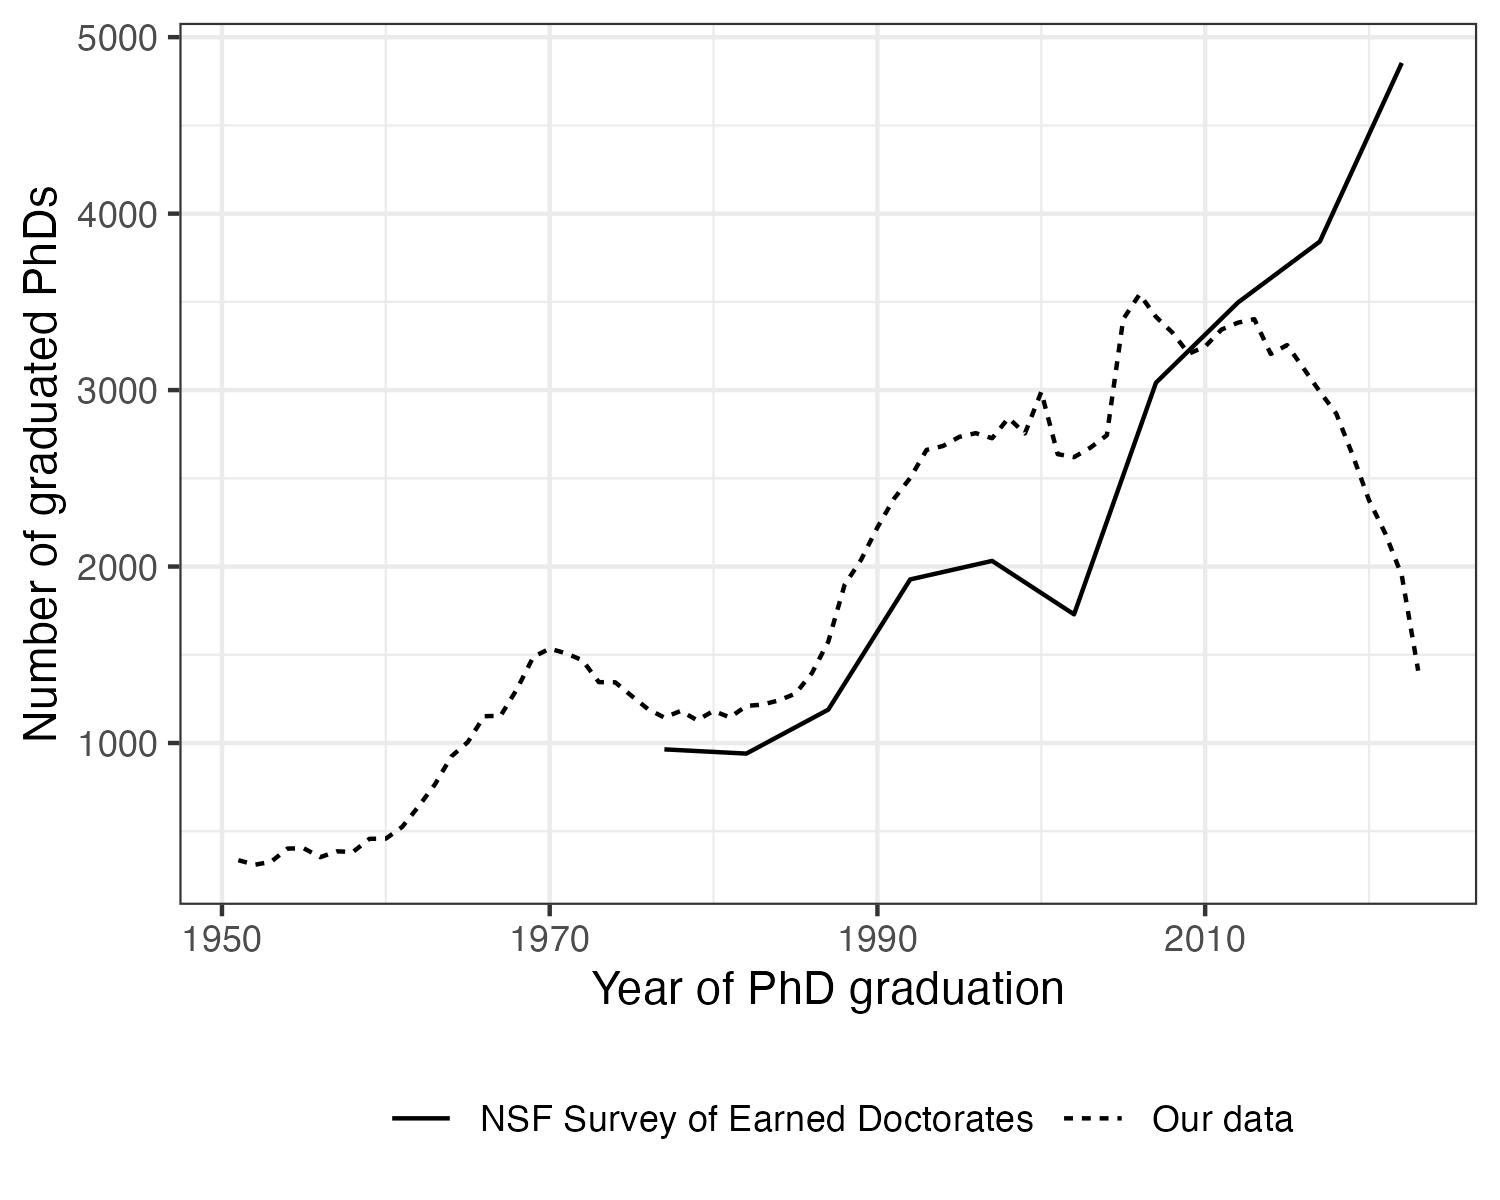
Data from the 2020 AMS Departmental Profile 🤦🏻♂️
*Actually this one is from 2017-2018 (Report on New Doctorates) 🤦🏻♂️🤦🏻♂️🤦🏻♂️
Much Work (Including From Here!)

Focus For Today
The Team

|
Heather Brooks |

|
Harlin Lee |

|
Mason Porter |

|
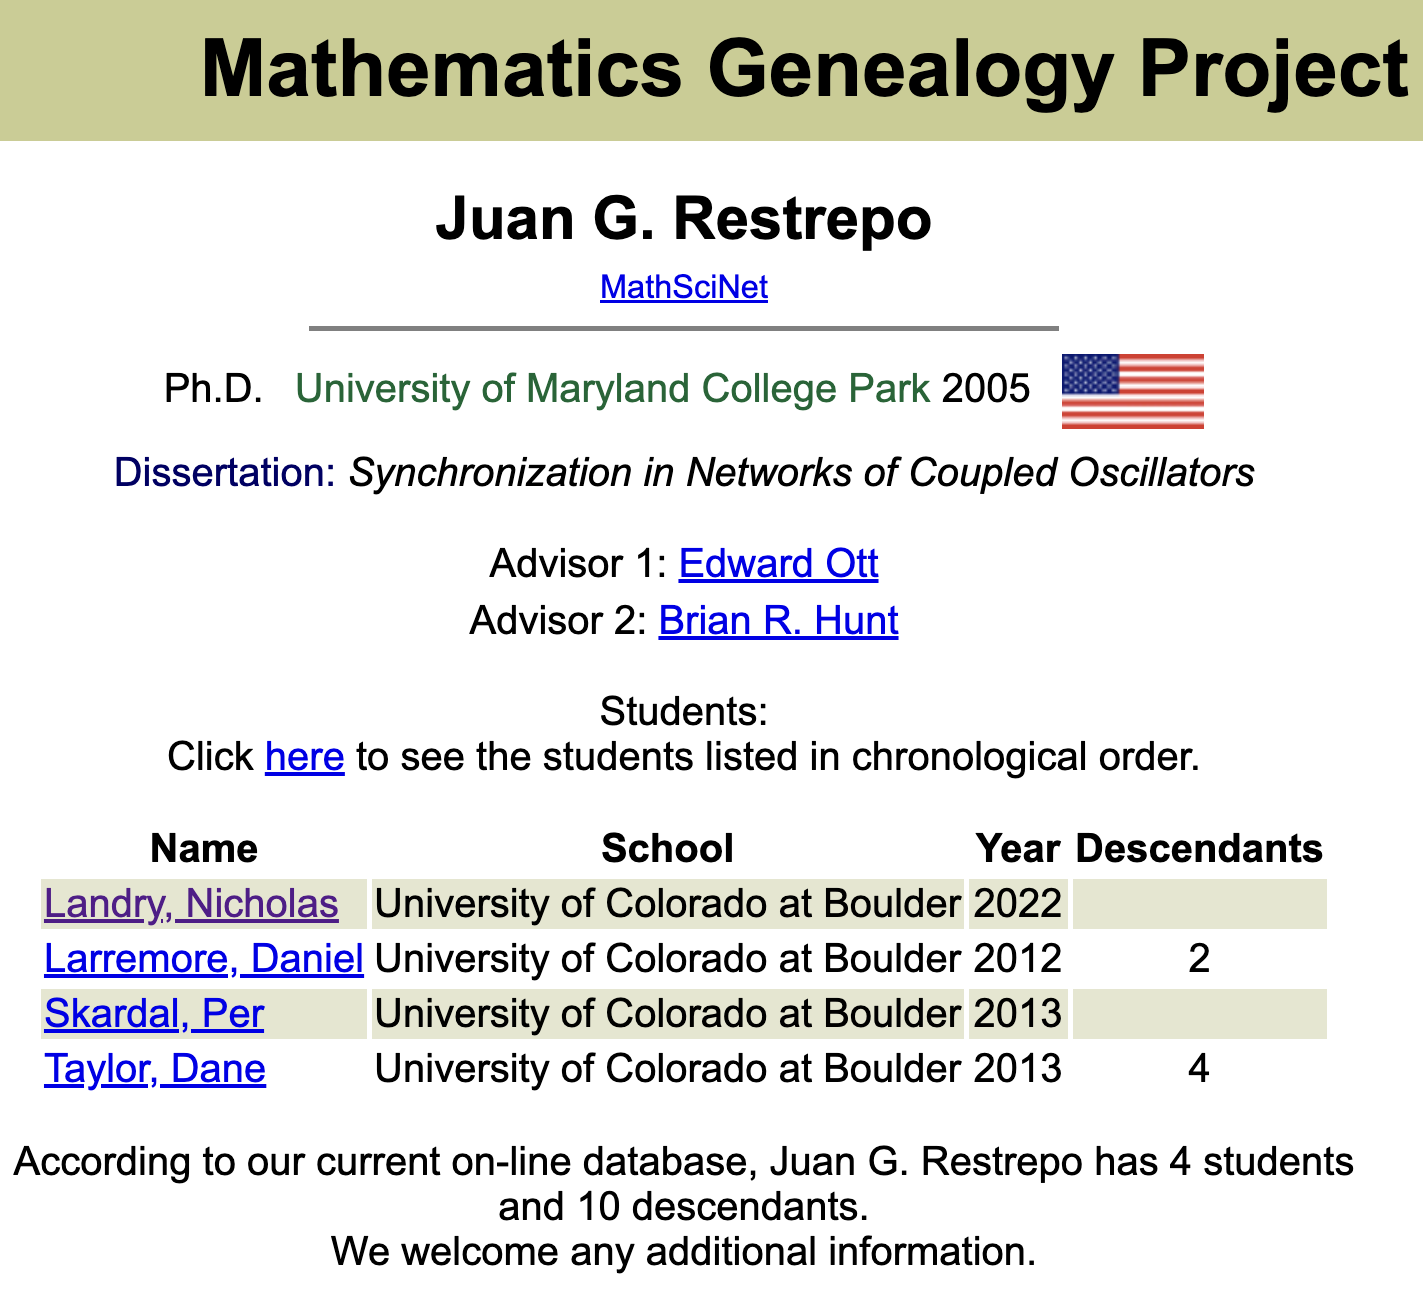
Juan G. Restrepo |

|
Anna Haensch |

|
Phil Chodrow |
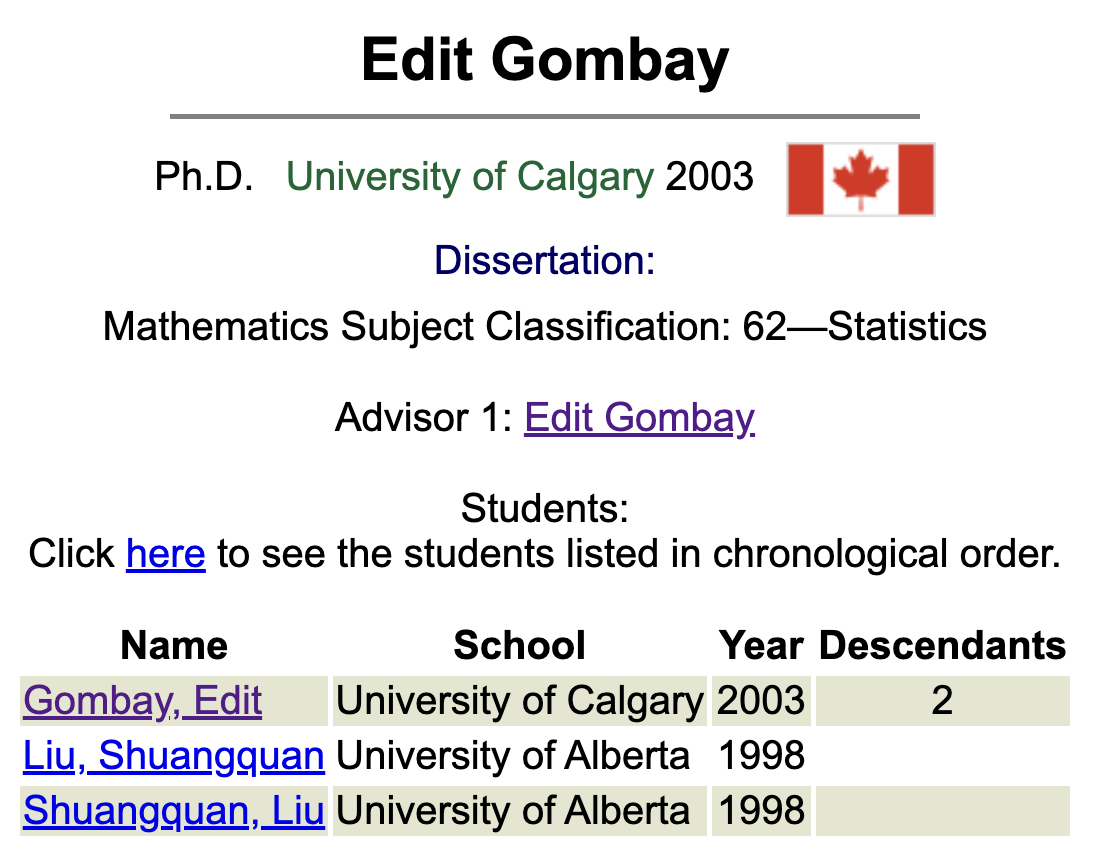
Our Data
Our Data


Ben Brill, UCLA ’22
Total of 116,306 advisor-student pairs in the US since 1950, representing 21,781 distinct advisors. We observe or estimate math subfields for 94% of these pairs (predictions based on thesis titles). We estimate gender for 95% of PhD students and 97% of advisors.
Data issues…
Misgendering
Incorrect MSCs inferred
More missing recent advisors –> undercounting female advisors
Various shenanigans
Generative model of advisor production
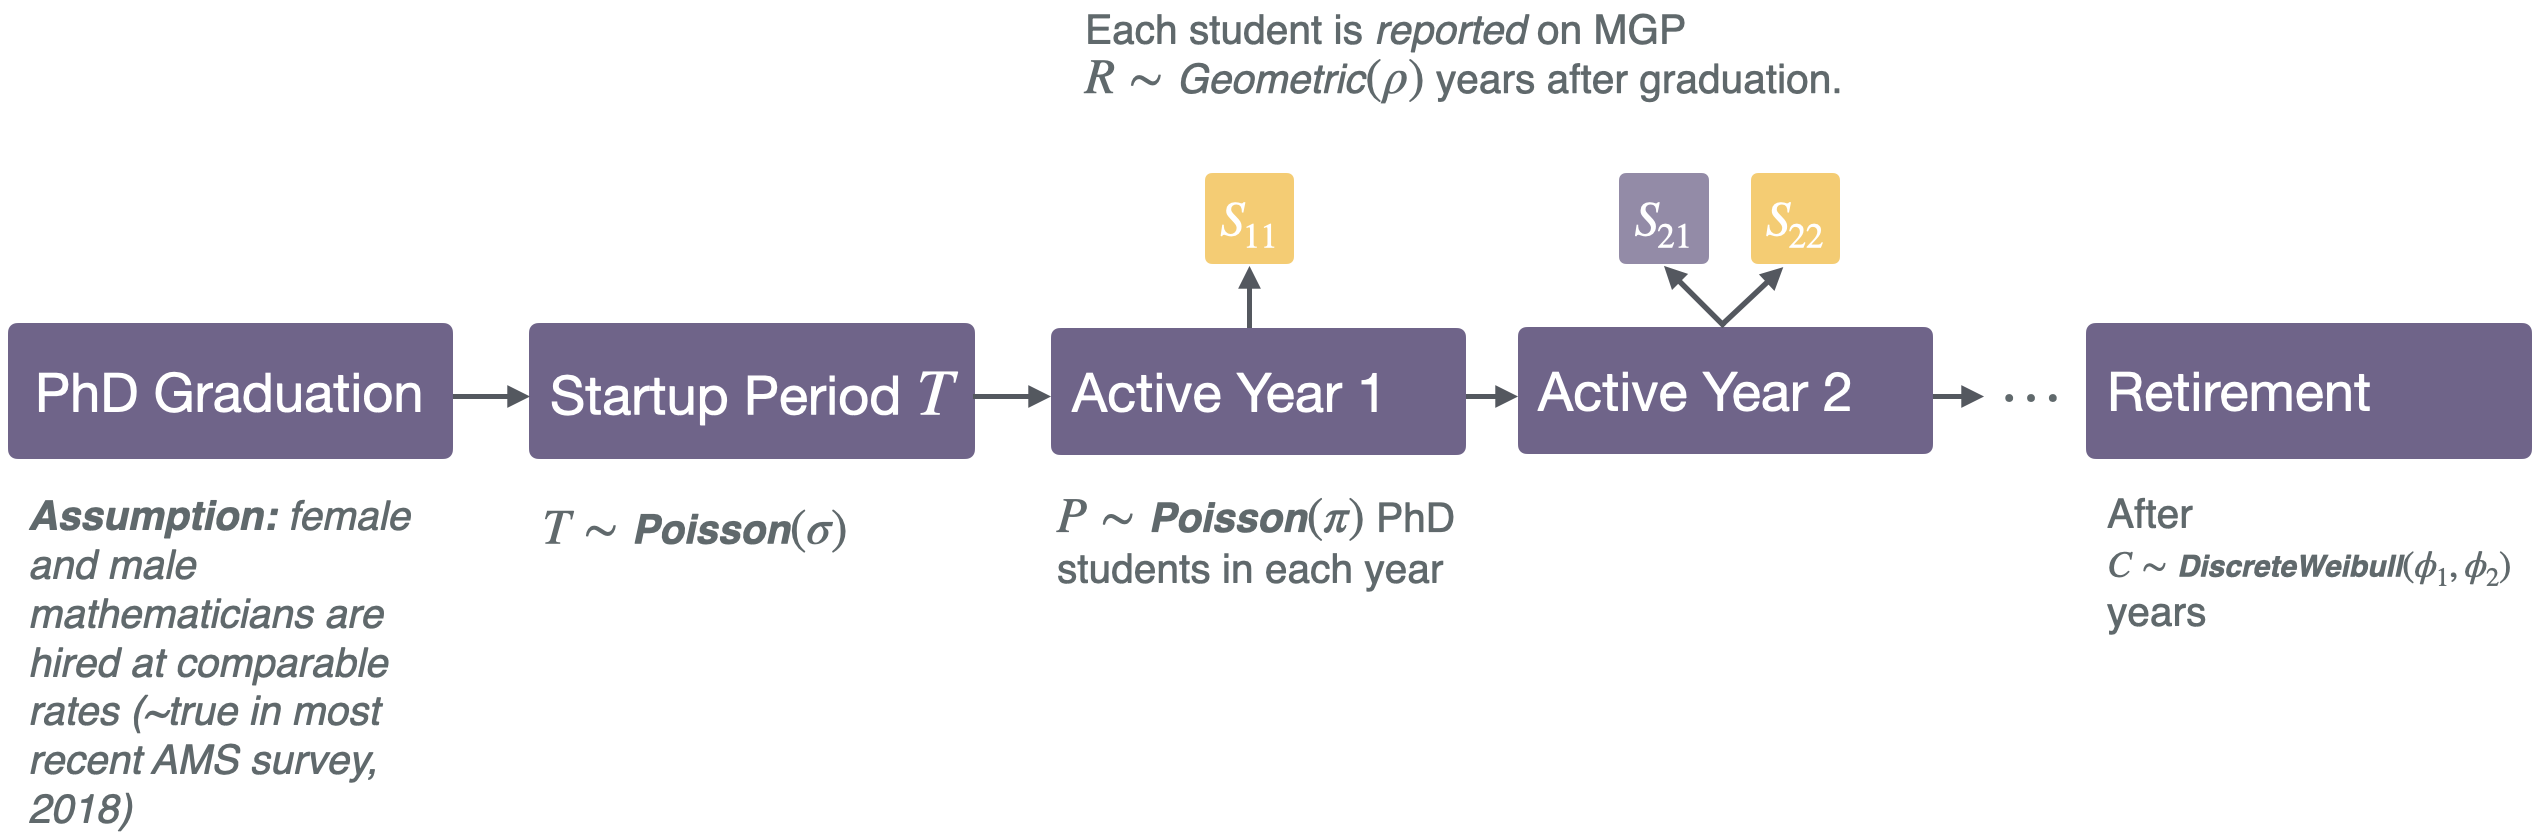
Assumptions:
- Startup depends on subfield.
- Career length depends on gender.
- # students per year depends on subfield and gender.
Men have estimated careers ~4 years longer (on average)
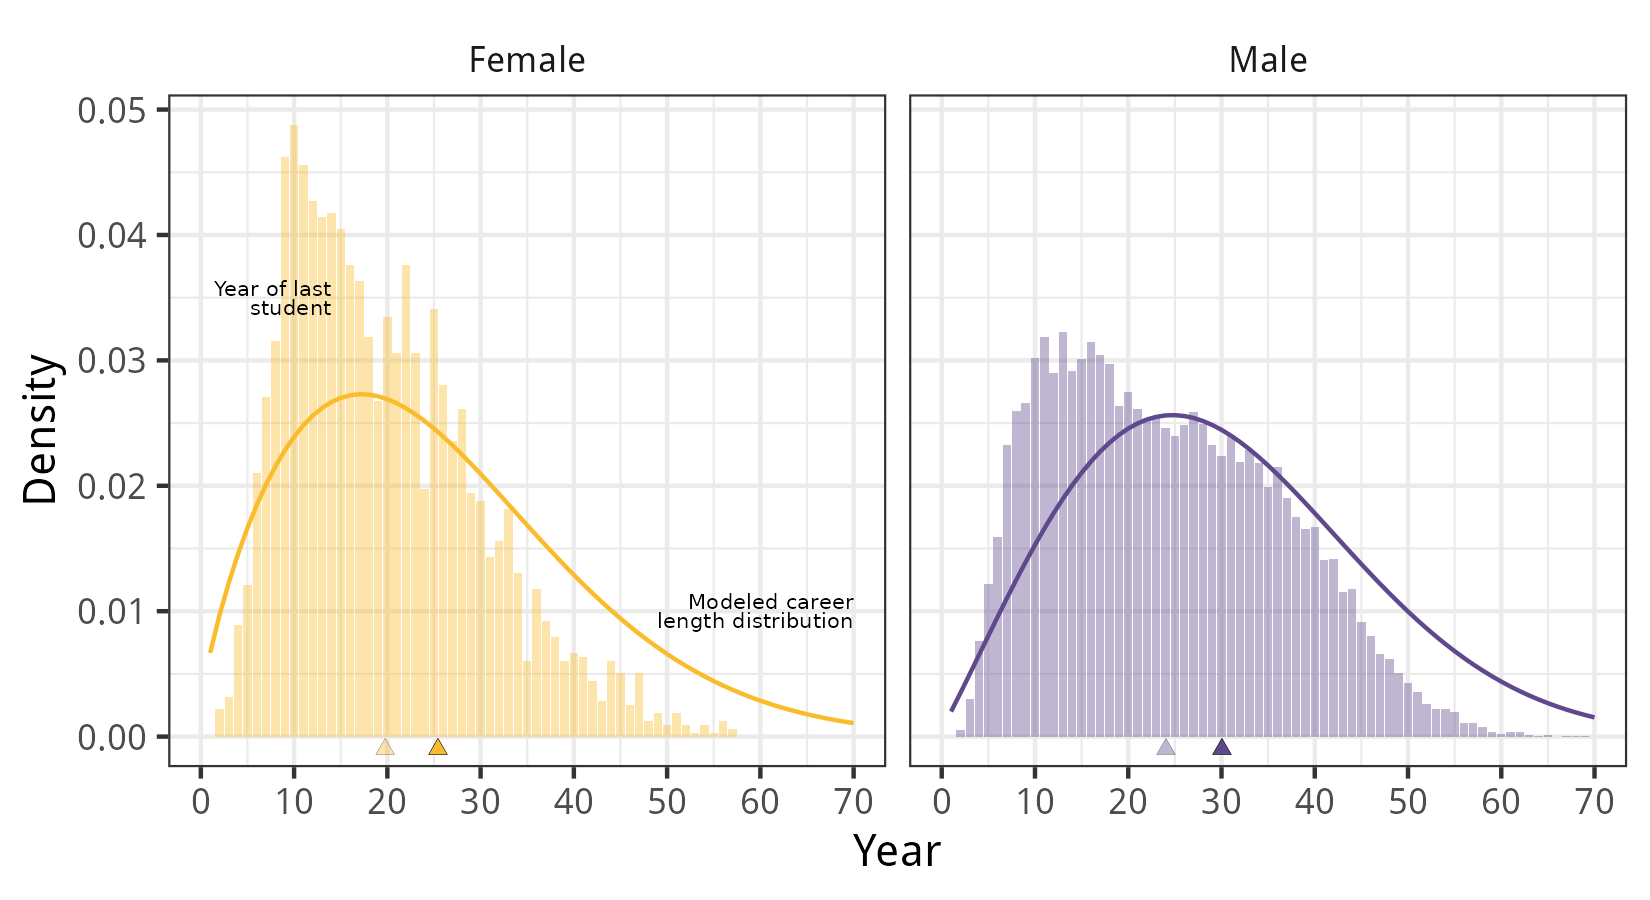
Attrition
Addressing disparities in career attrition for female faculty would help to close the gender gap.
Qualitative match to Barrett-Walker et al. (2023).
Longer careers \(\times\) more students per year = more students per career
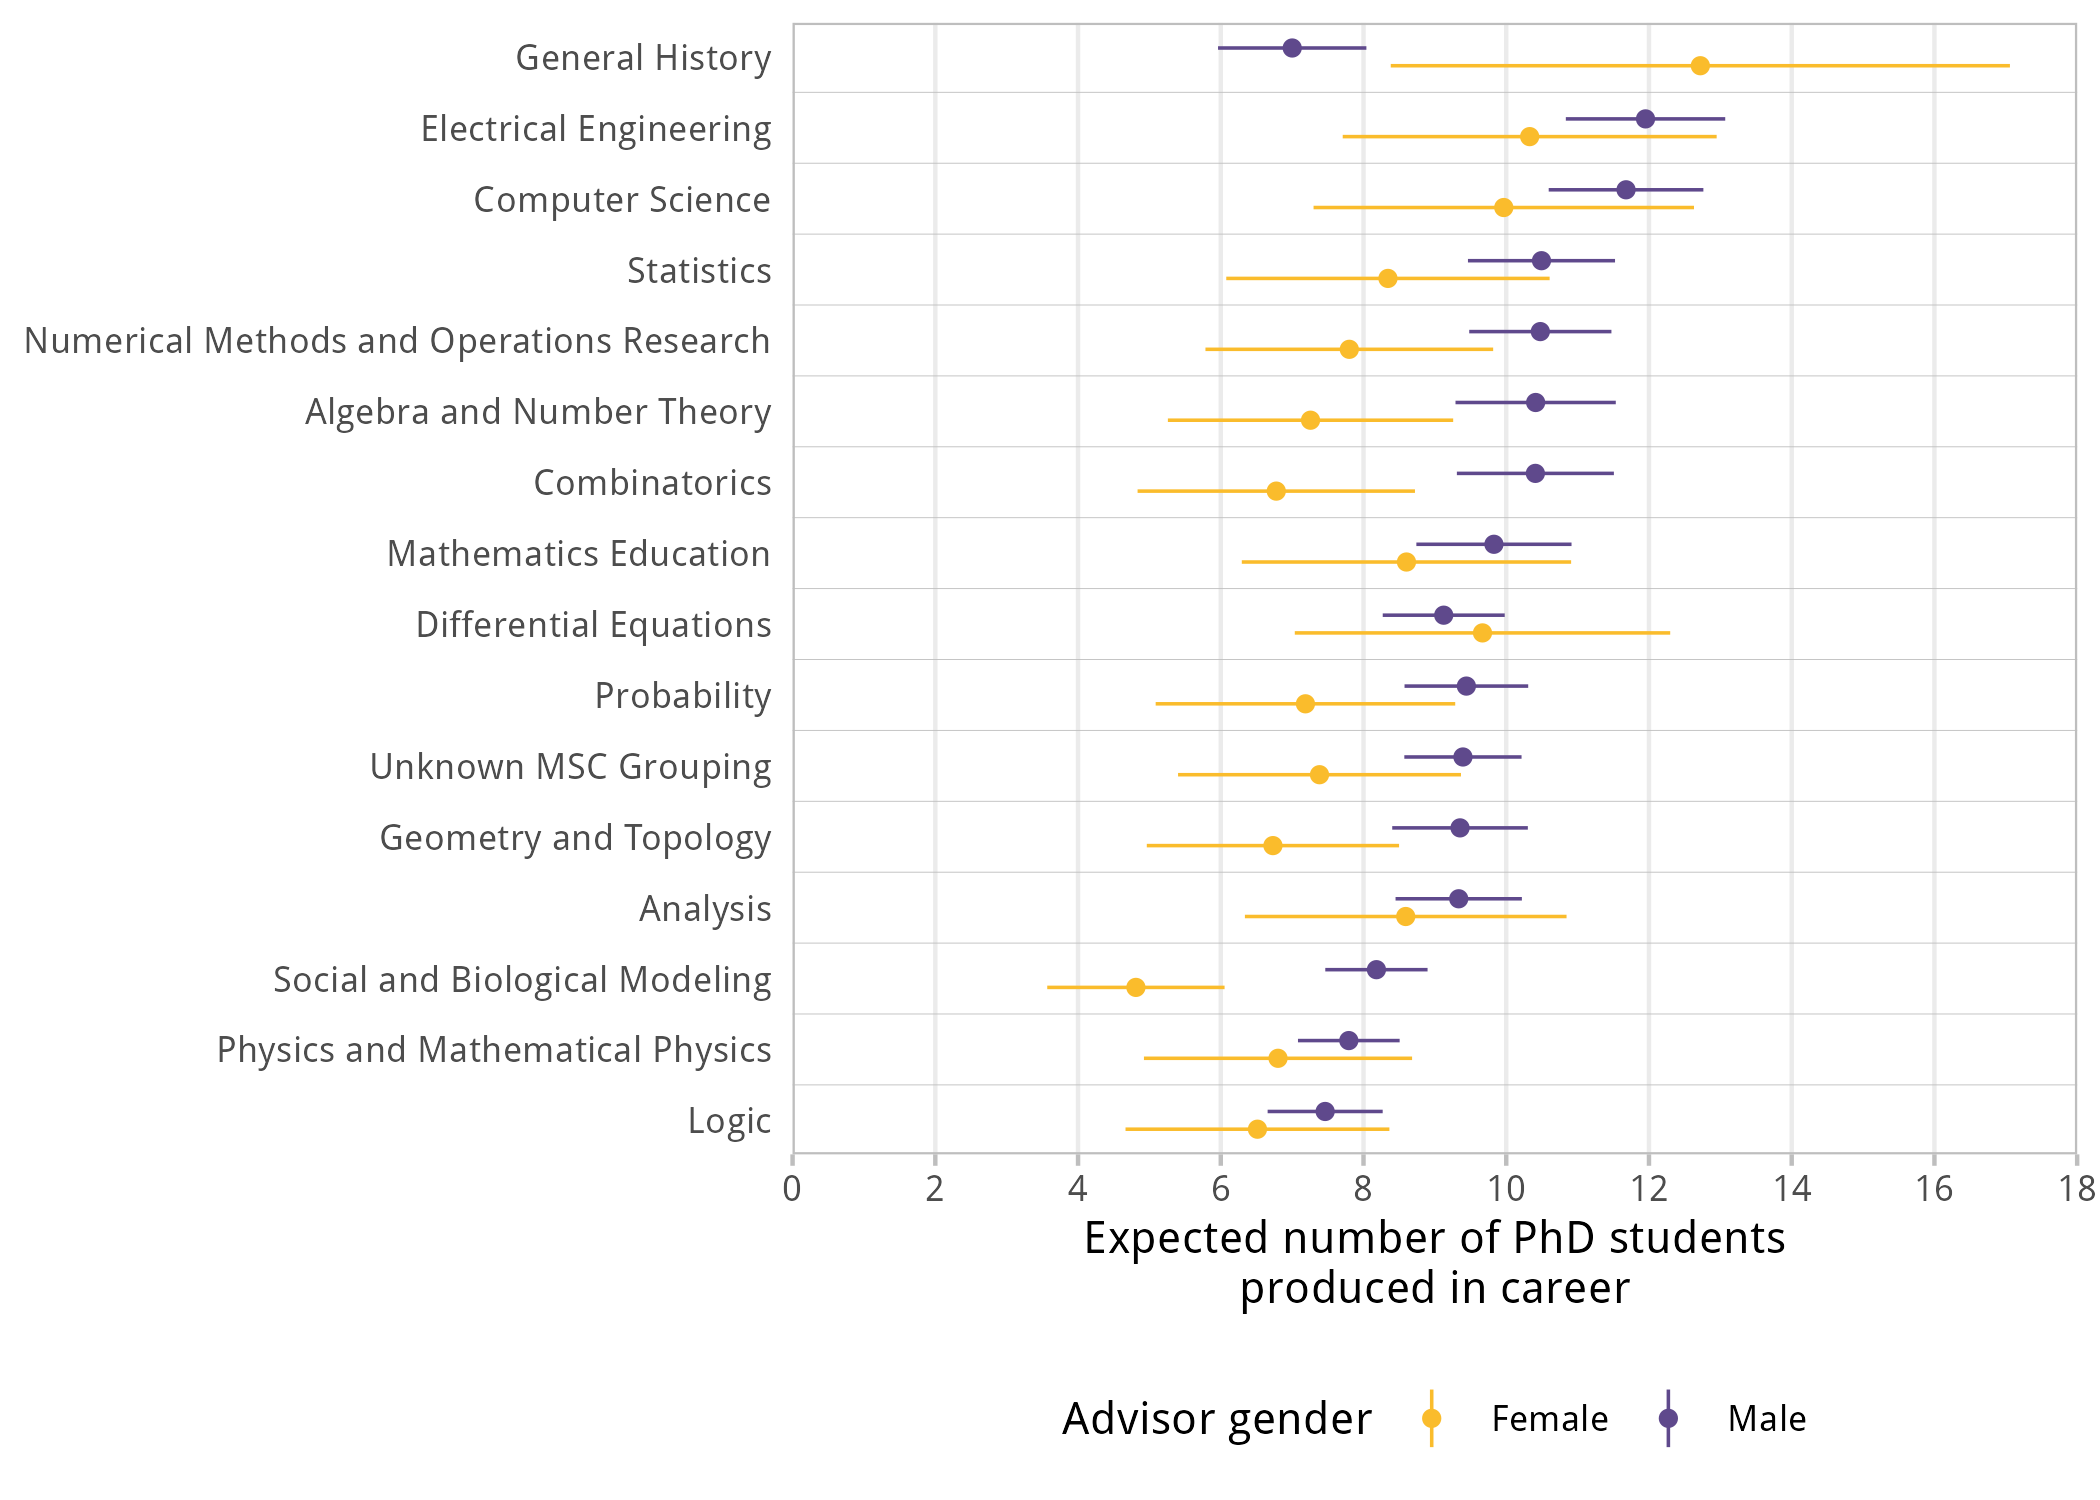
We hypothesize that greater student production per year by male advisors reflects unequal access to research resources; cf. Zhang et al. (2022)
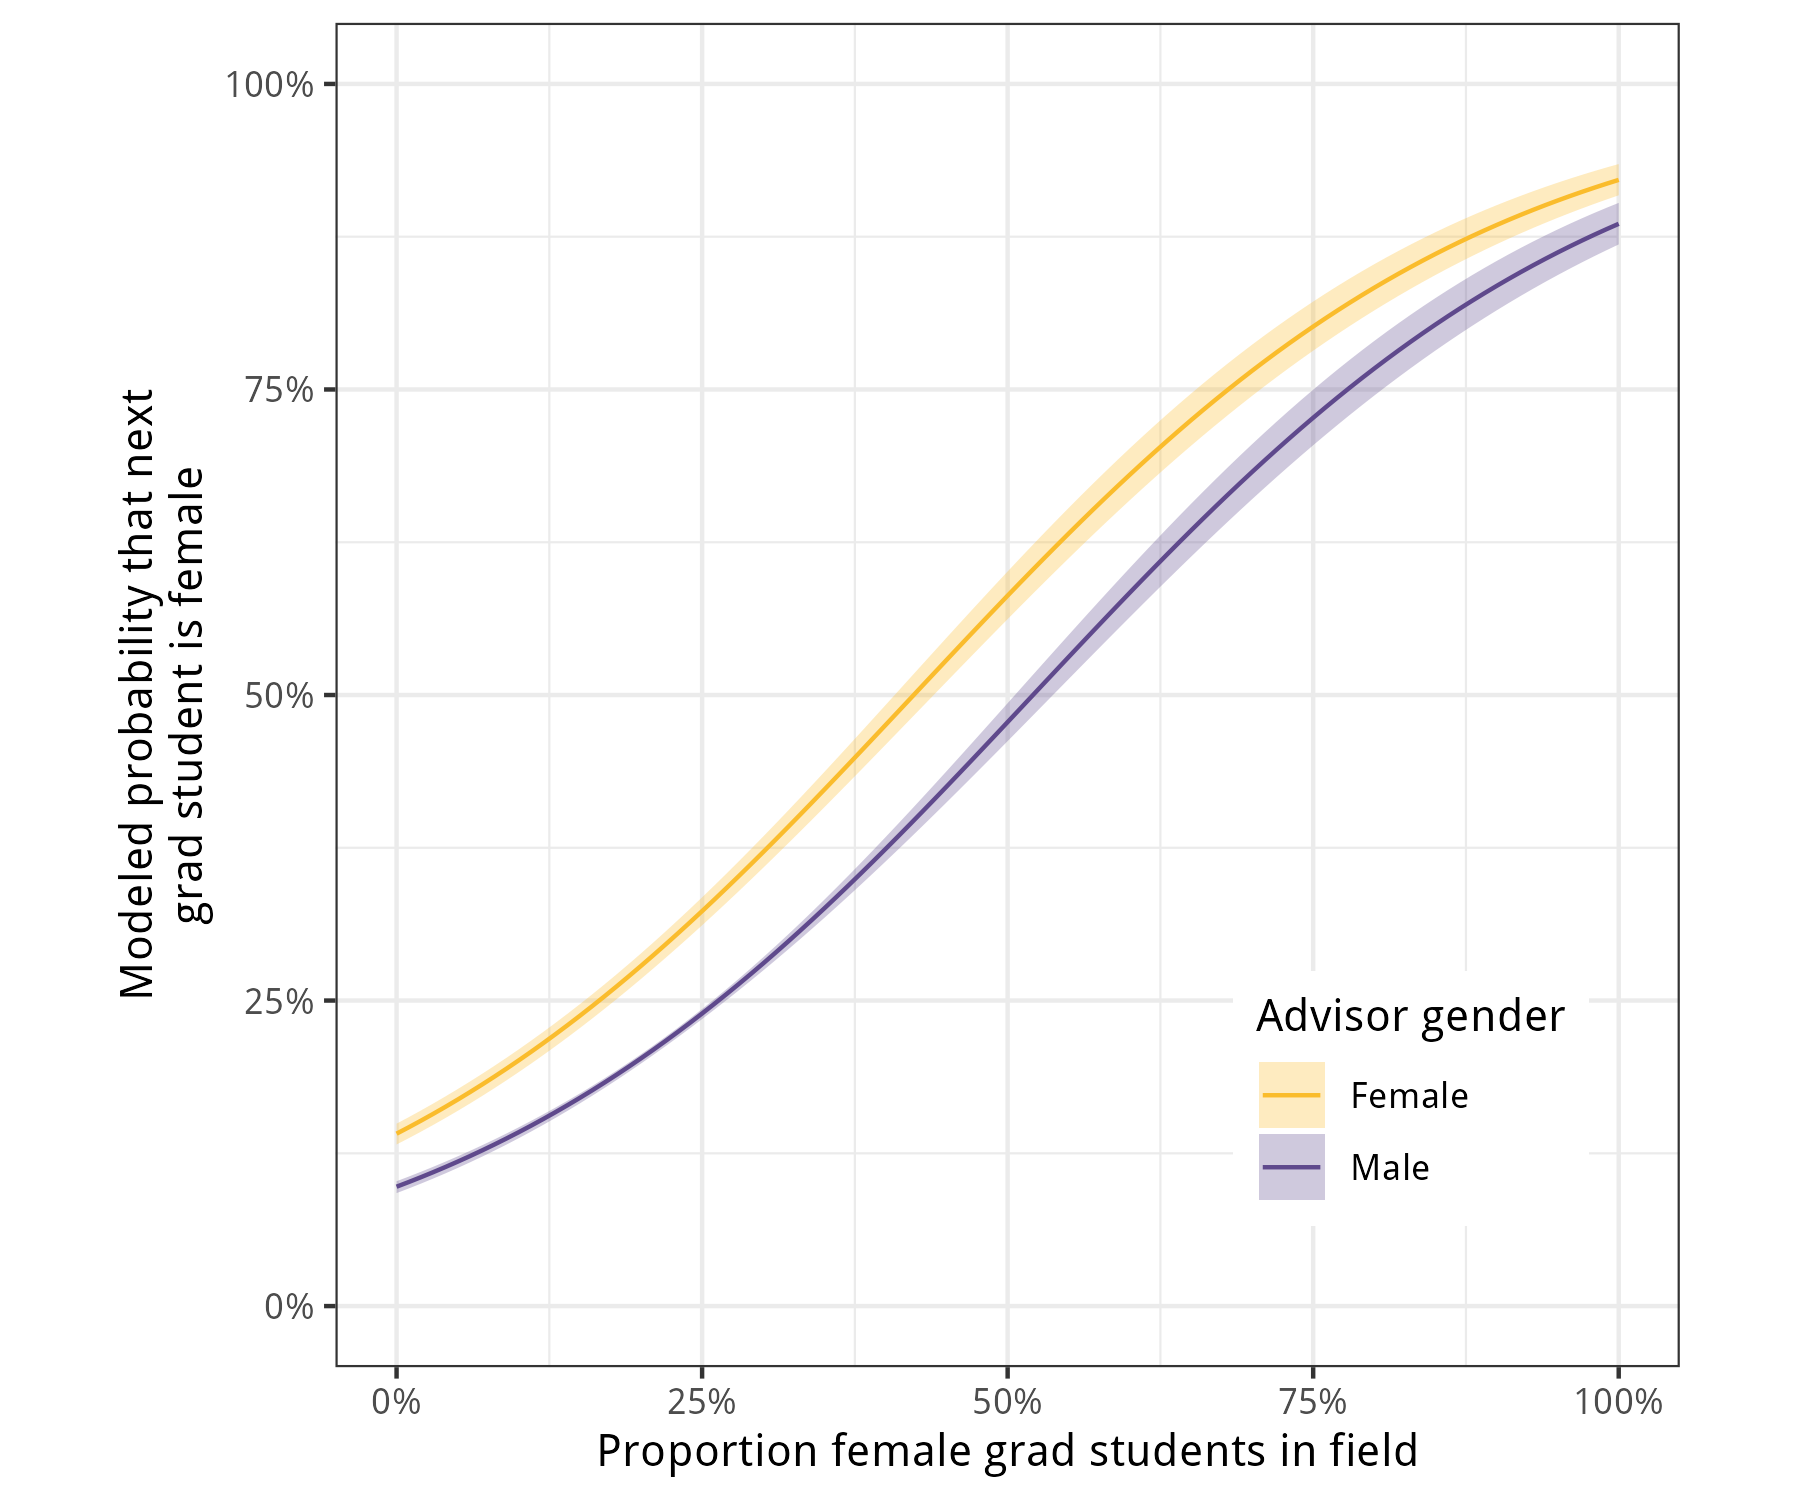
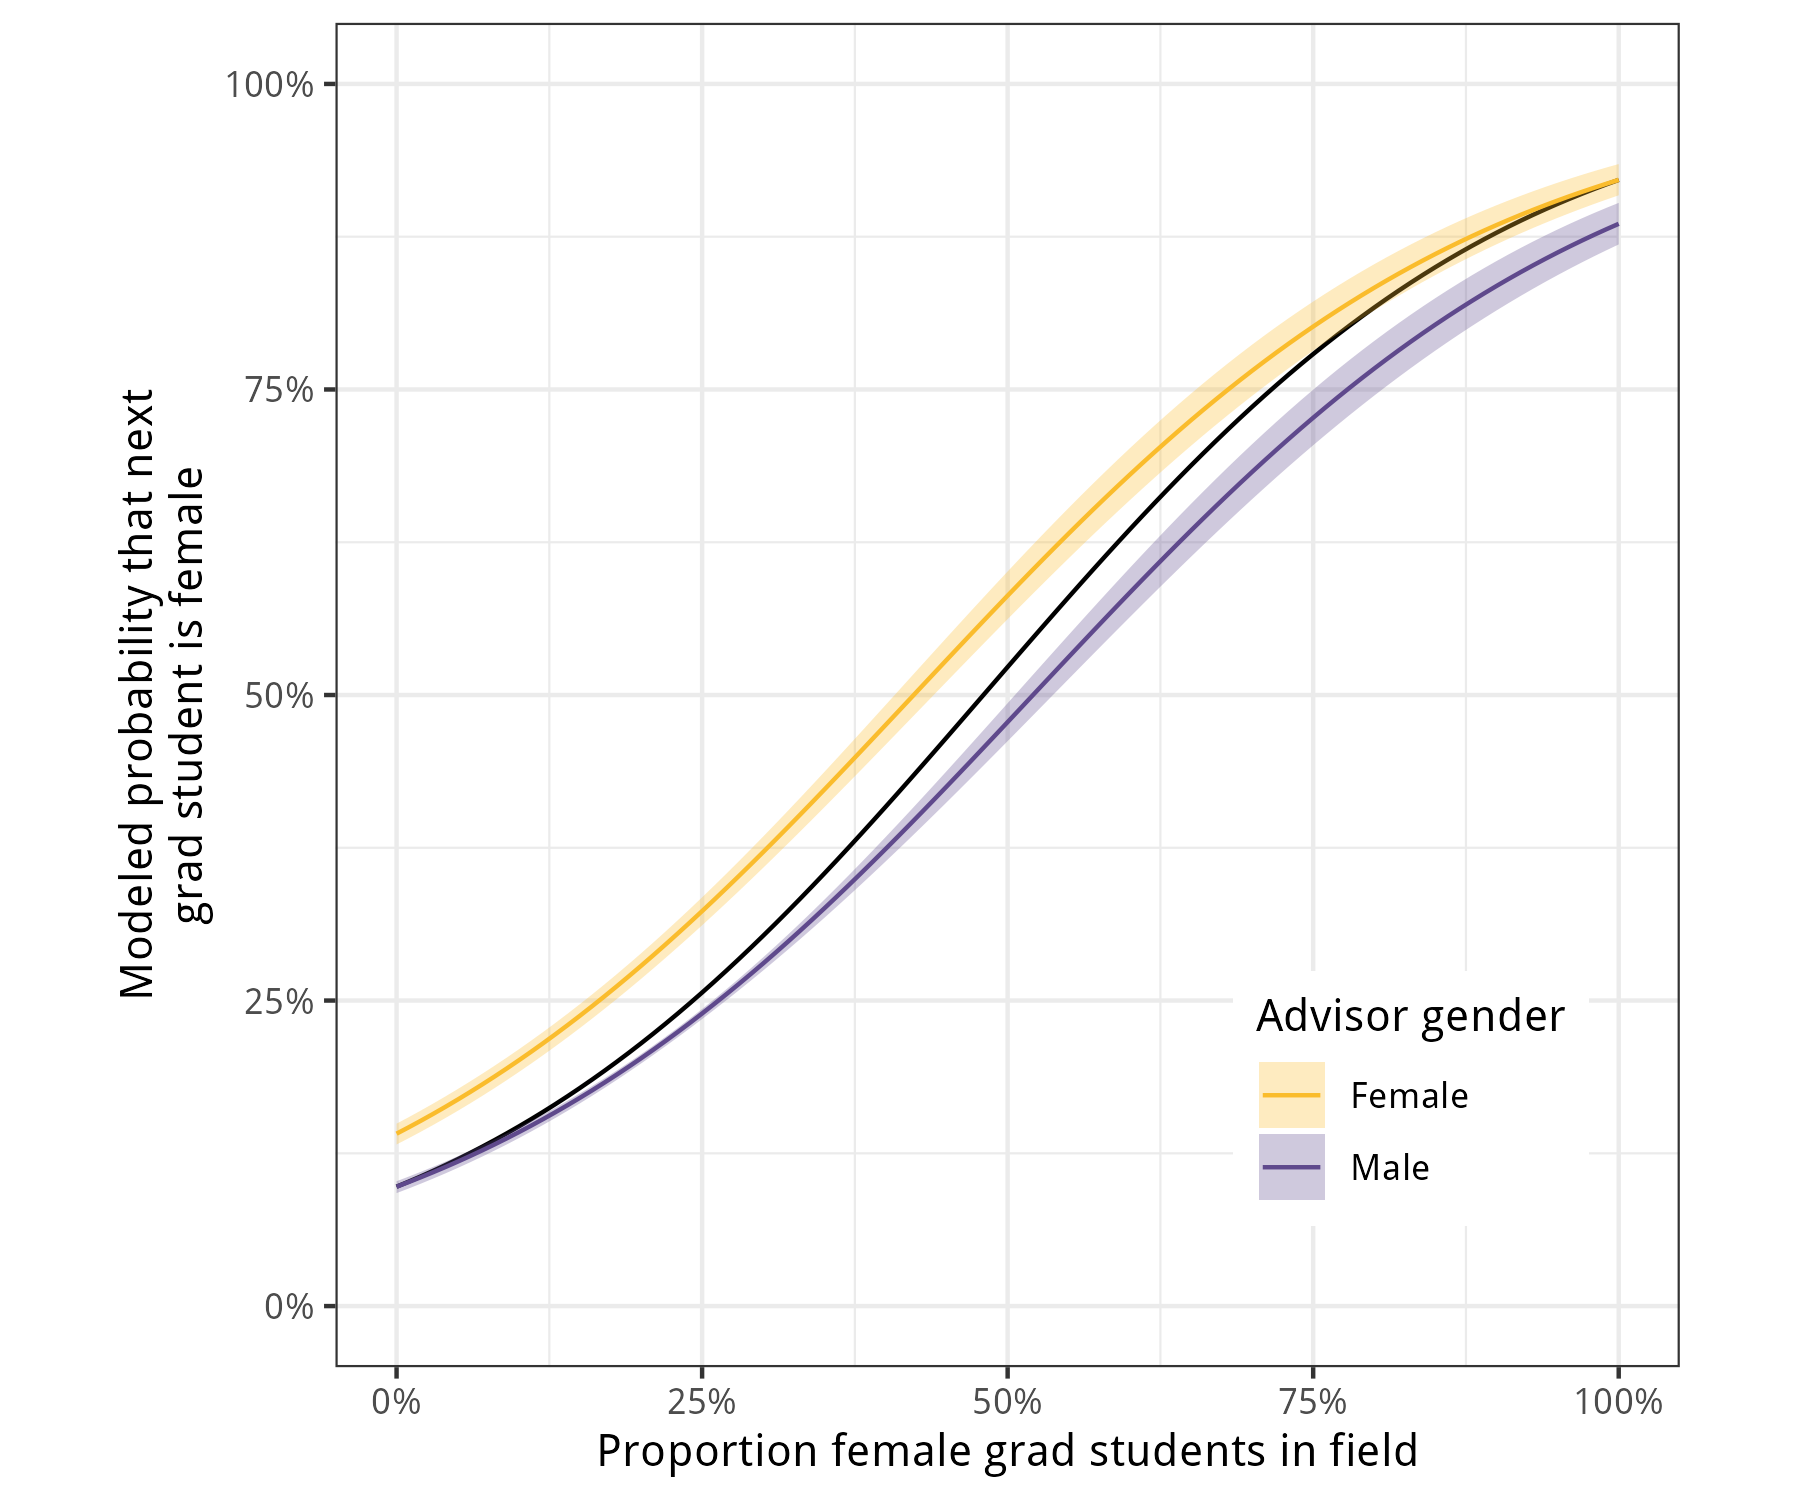
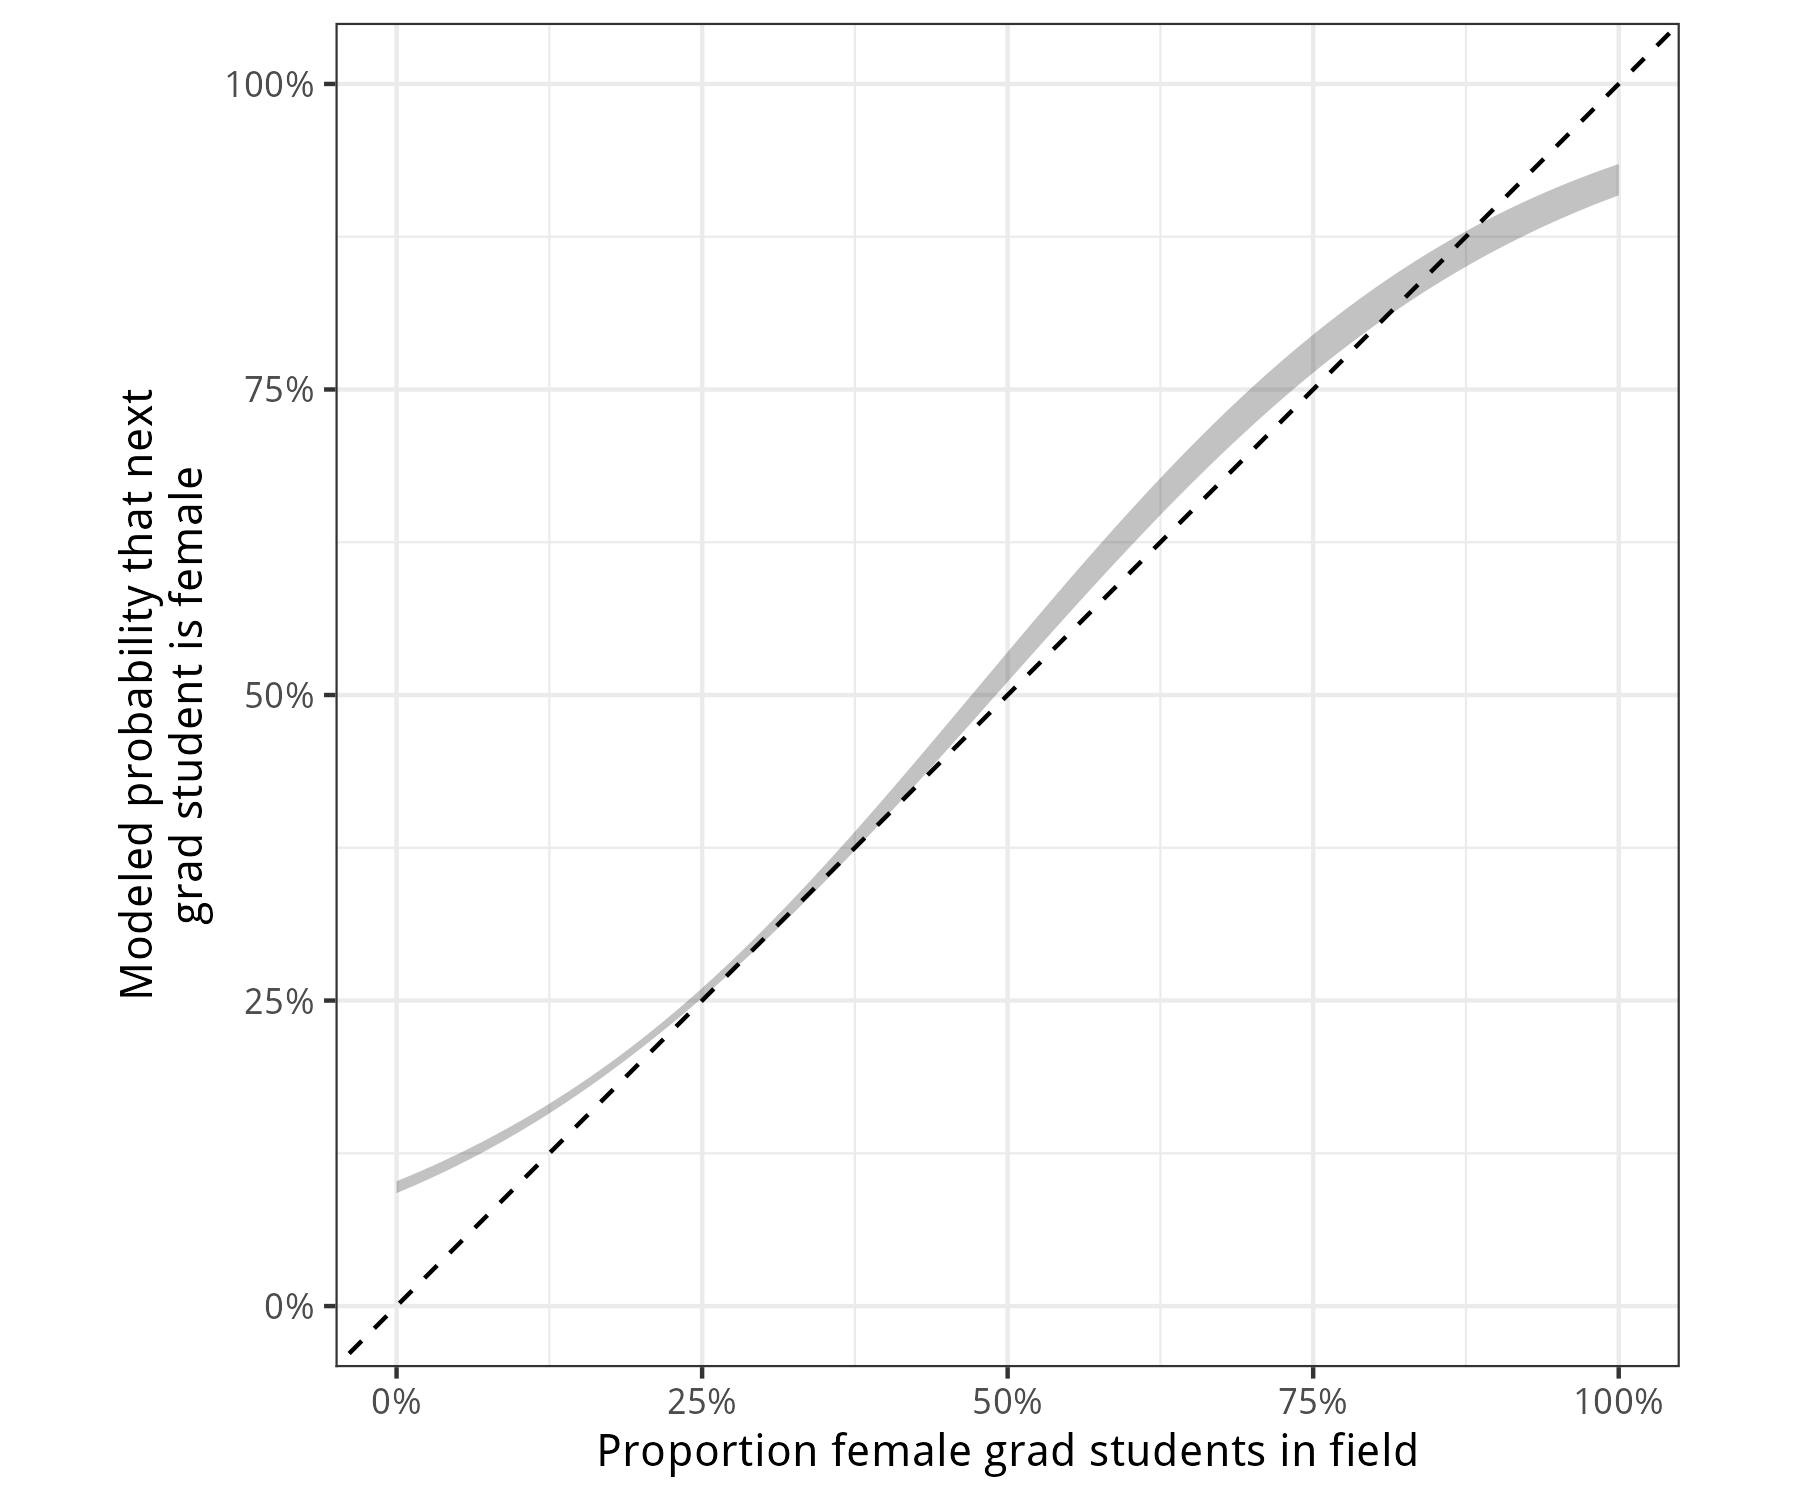
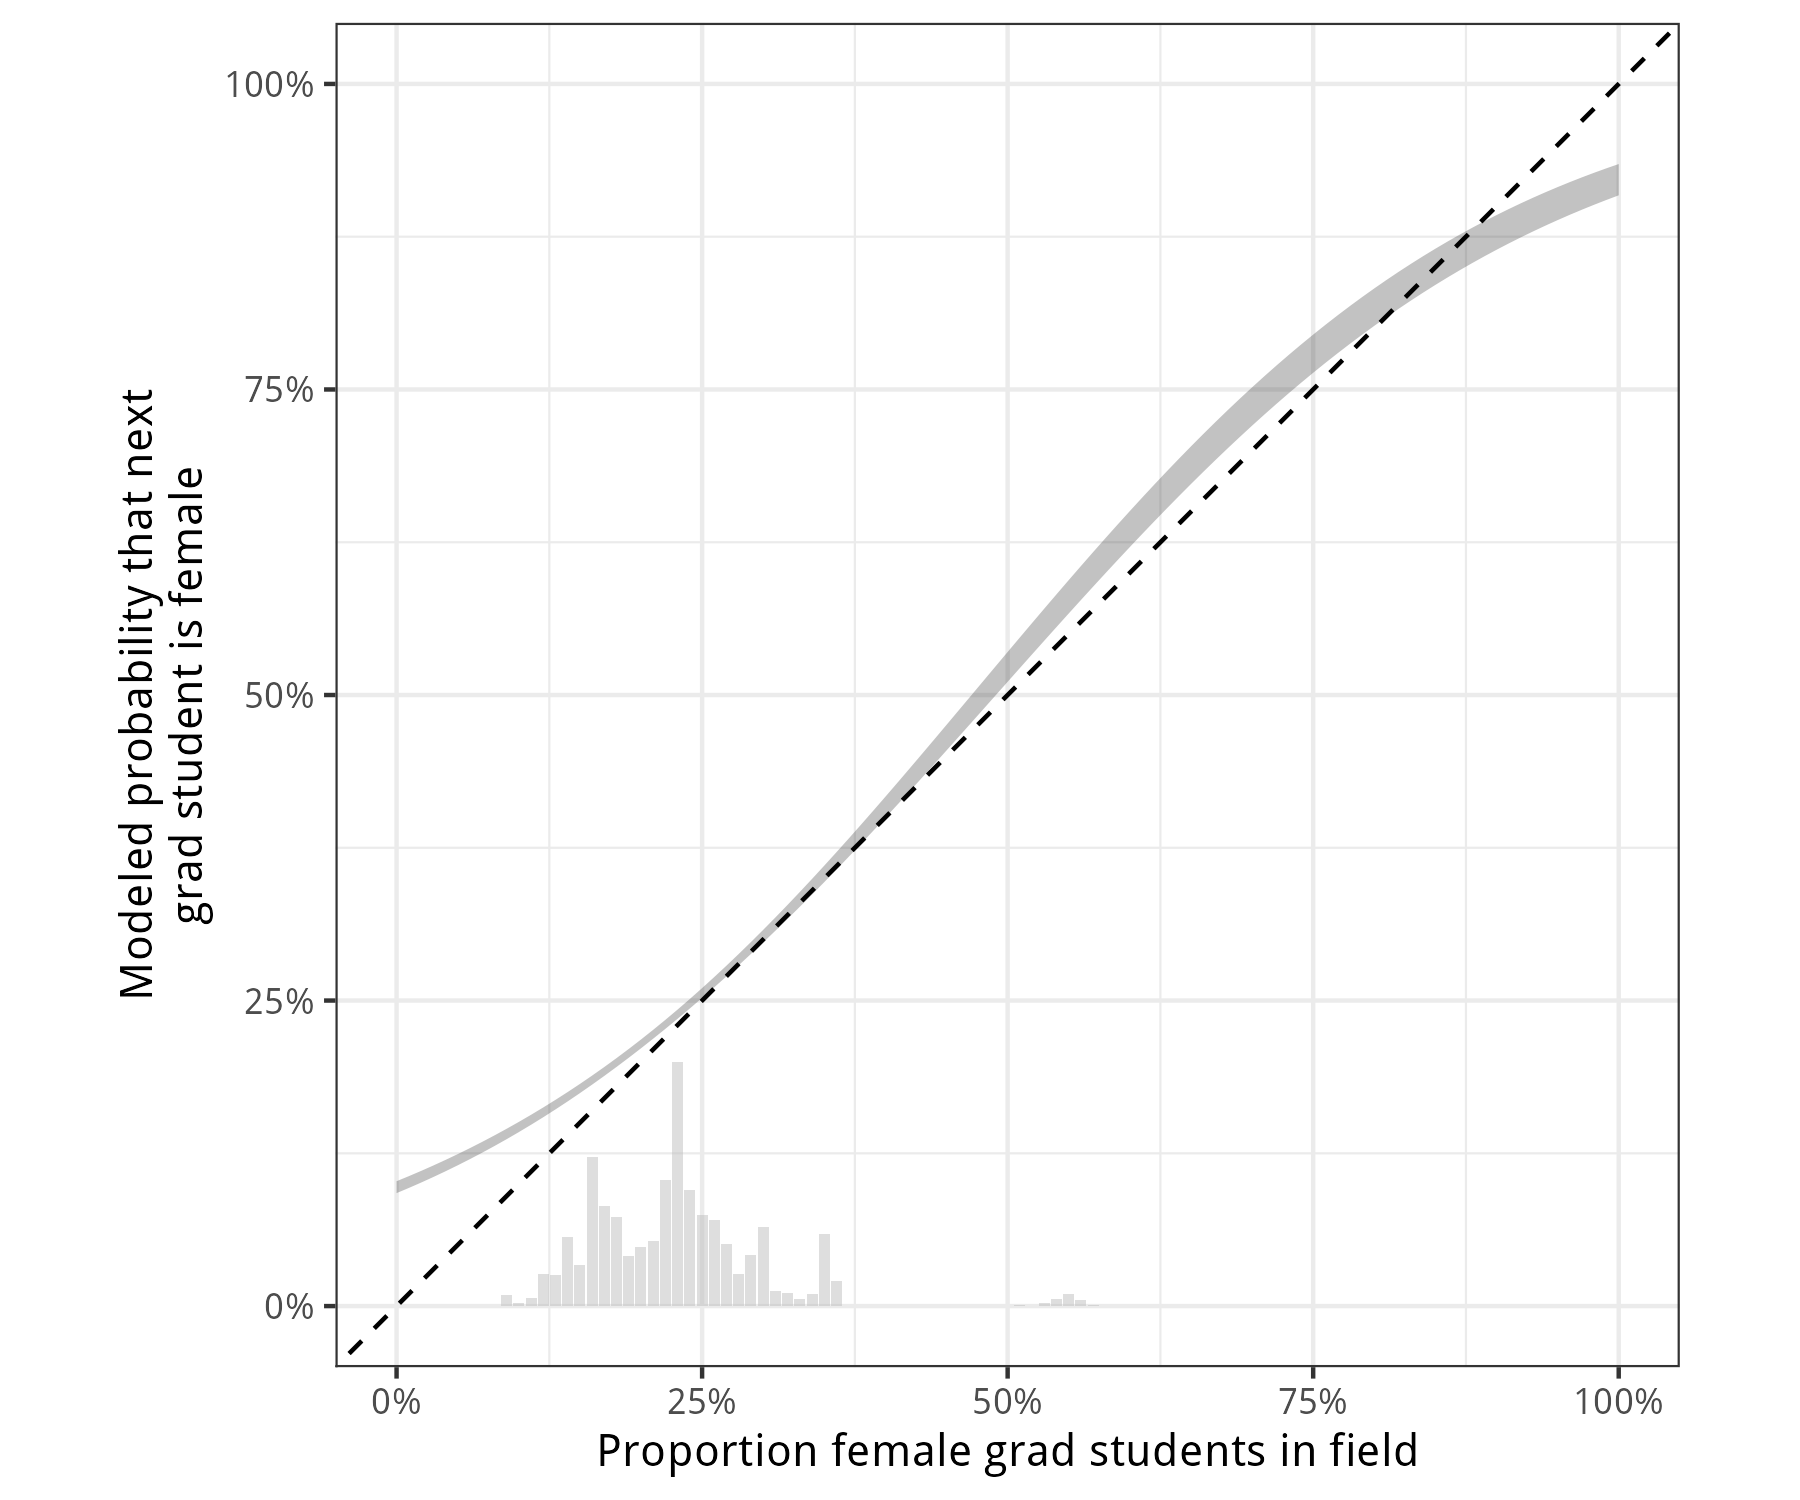
Homophily effects: advisor-student and student-student
Both the gender of a students’ specific advisor and the overall proportion of female advisors in the subfield’s population contribute to the likelihood that the student is female.
High uncertainty in the model predictions for large \(p_F\) reflects the fact that we have very little data in that region.
Interlude: The Cool Math Story I Wanted To Tell You
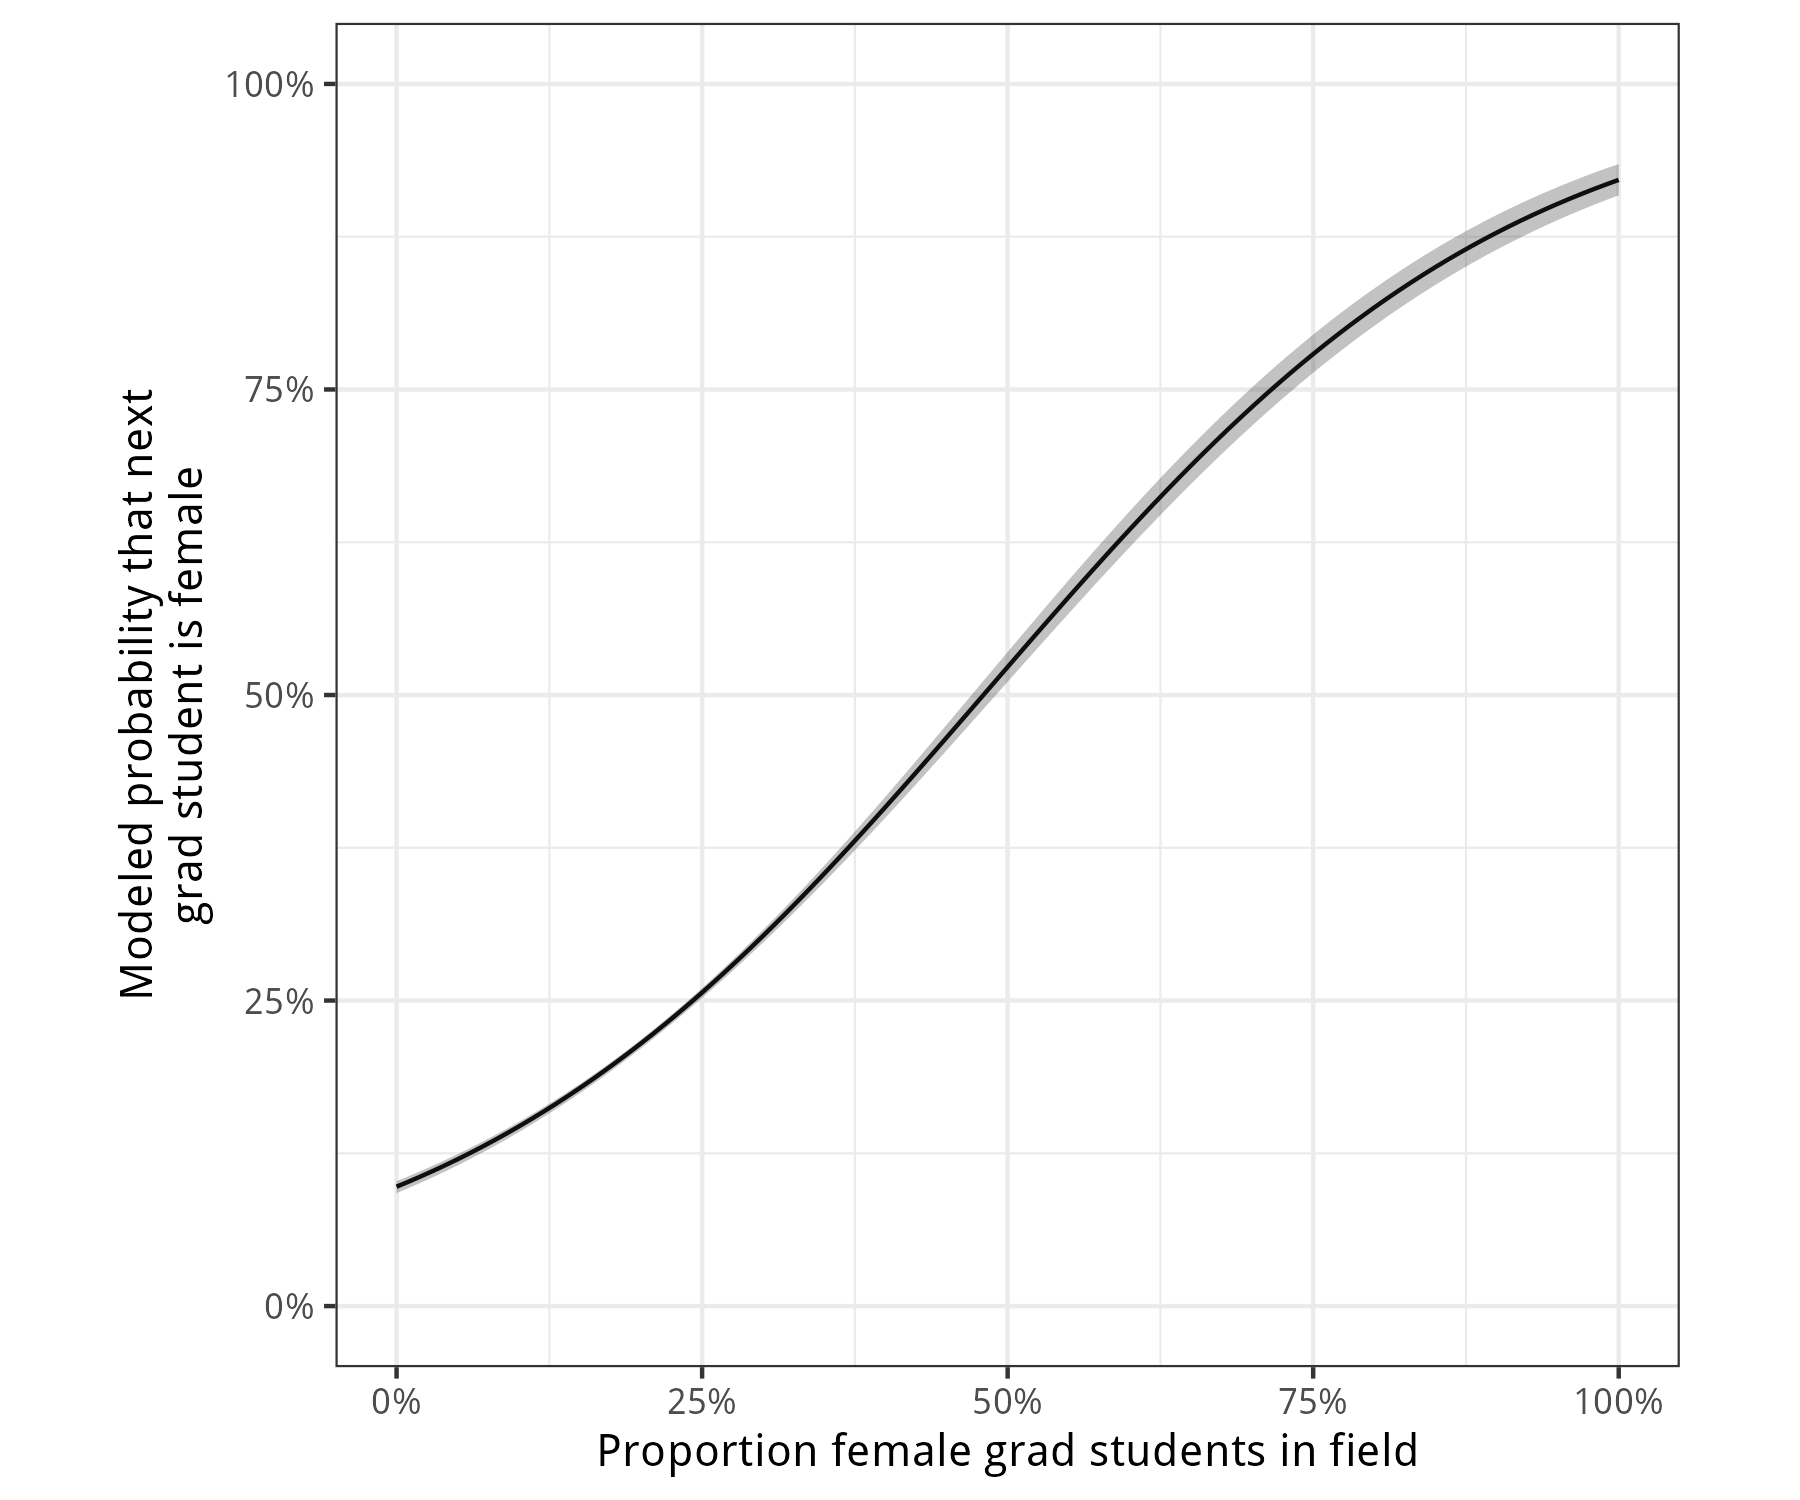
If \(p^*\) is the stationary proportion of graduates in the subfield, then \(p^*\) approximately satisfies \[ \begin{aligned} p^* = \color{#ffaf03}{w_f}\color{#ffaf03}{\sigma_f}(p^*) + \color{#5b427c}{w_m} \color{#5b427c}{\sigma_m}(p^*) \end{aligned} \]
\(\sigma_g(p^*)\): prob. next student of an advisor of gender \(g\) is female.
\(w_g\): proportion of students in subfield advised by advisors of gender \(g\) (estimated from advisor production model).
Mean-field assumption: advisor groups have same demographics as advisor’s subfield.
Instead: What might we expect near-to-medium term?
100 simulations initialized with 1,000 active advisors who received PhDs over period 1980-2000, 20% female.
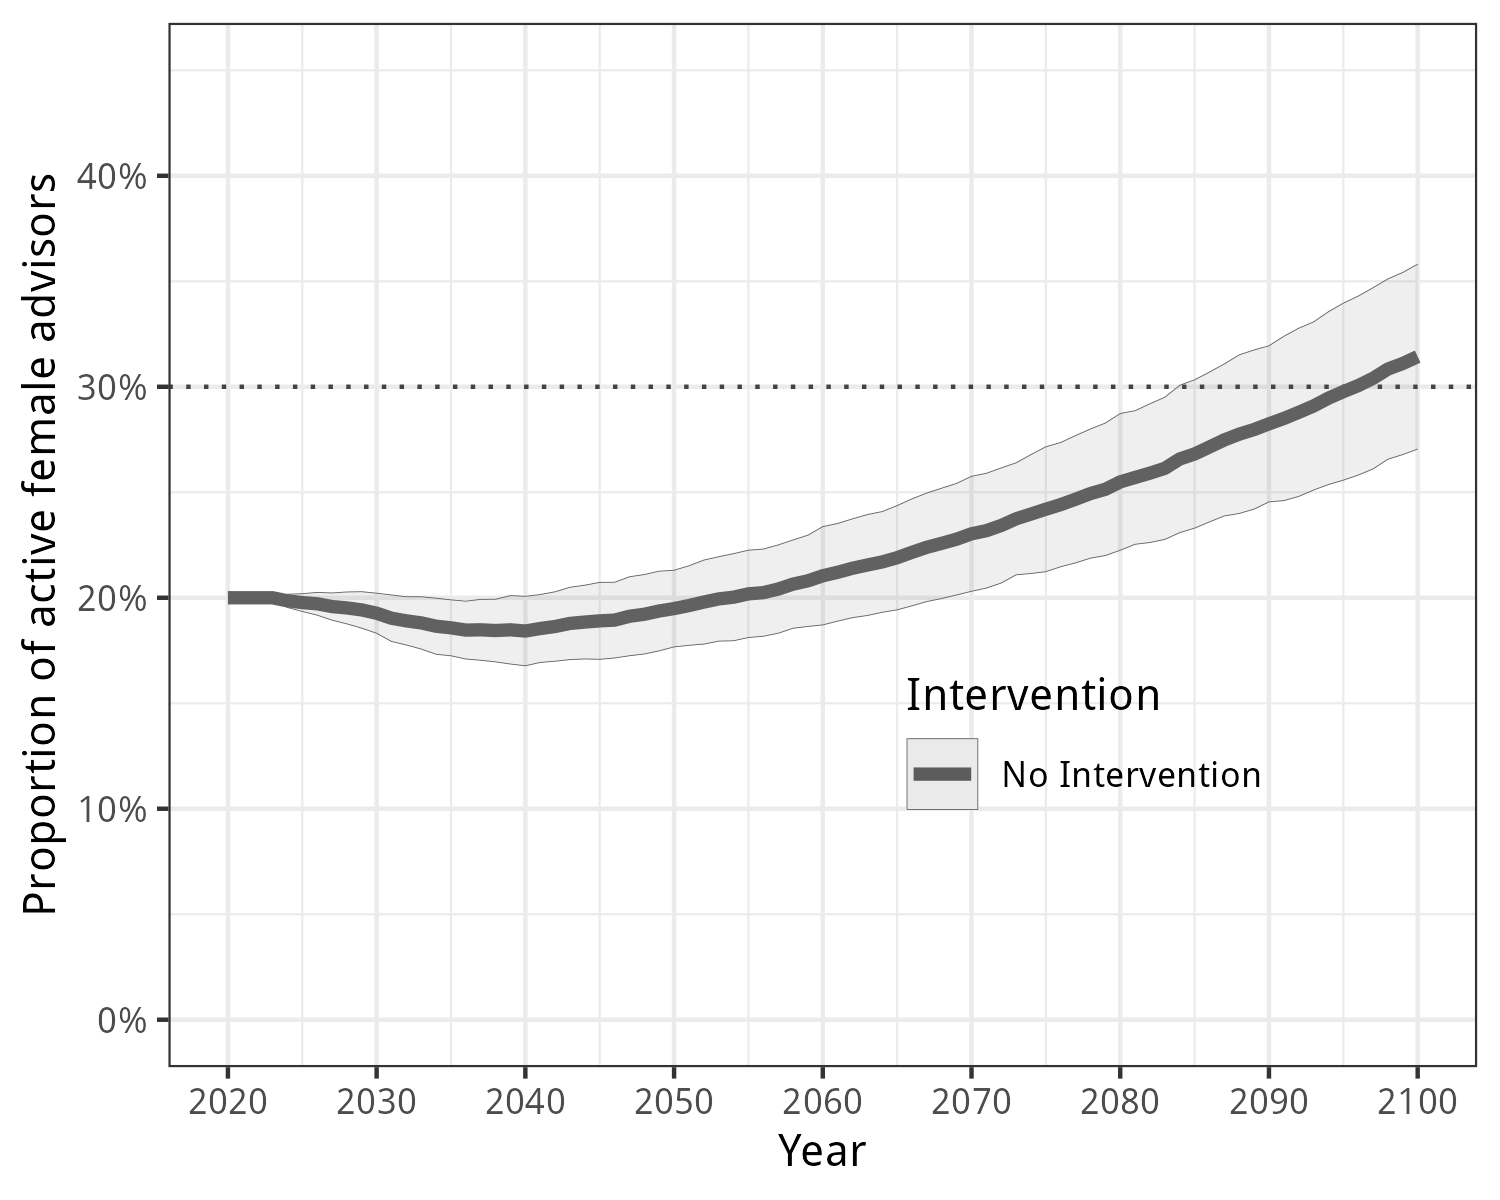
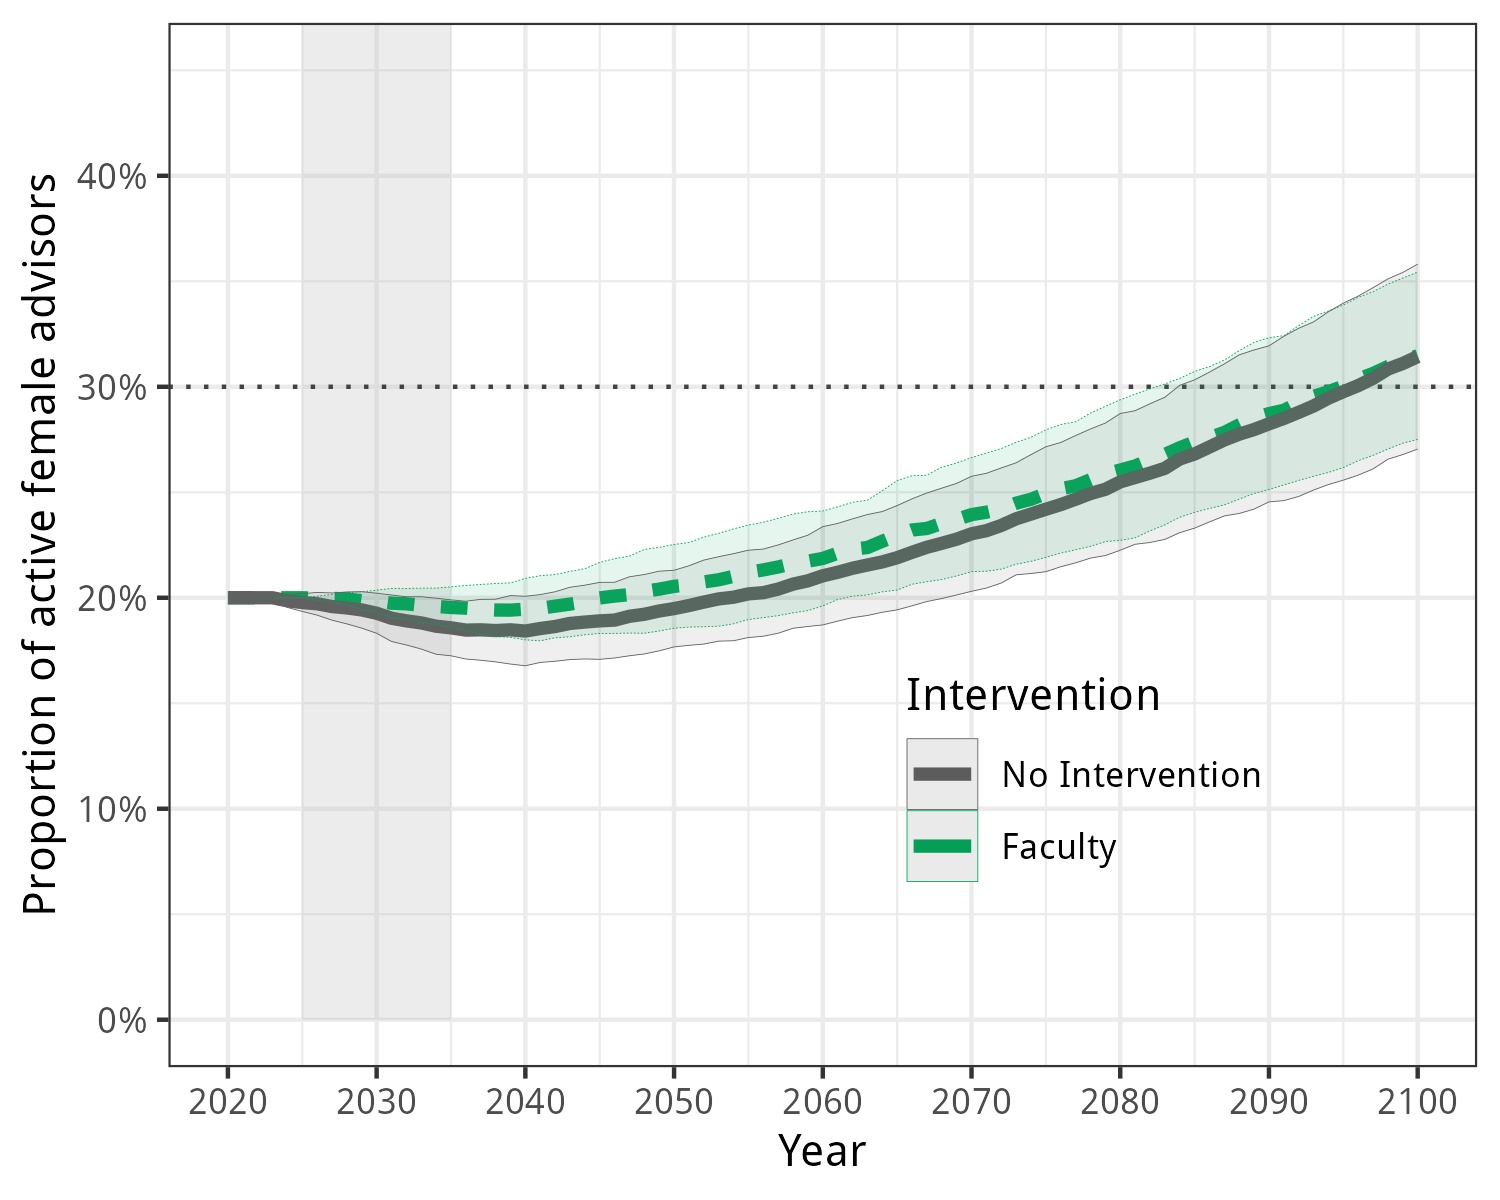
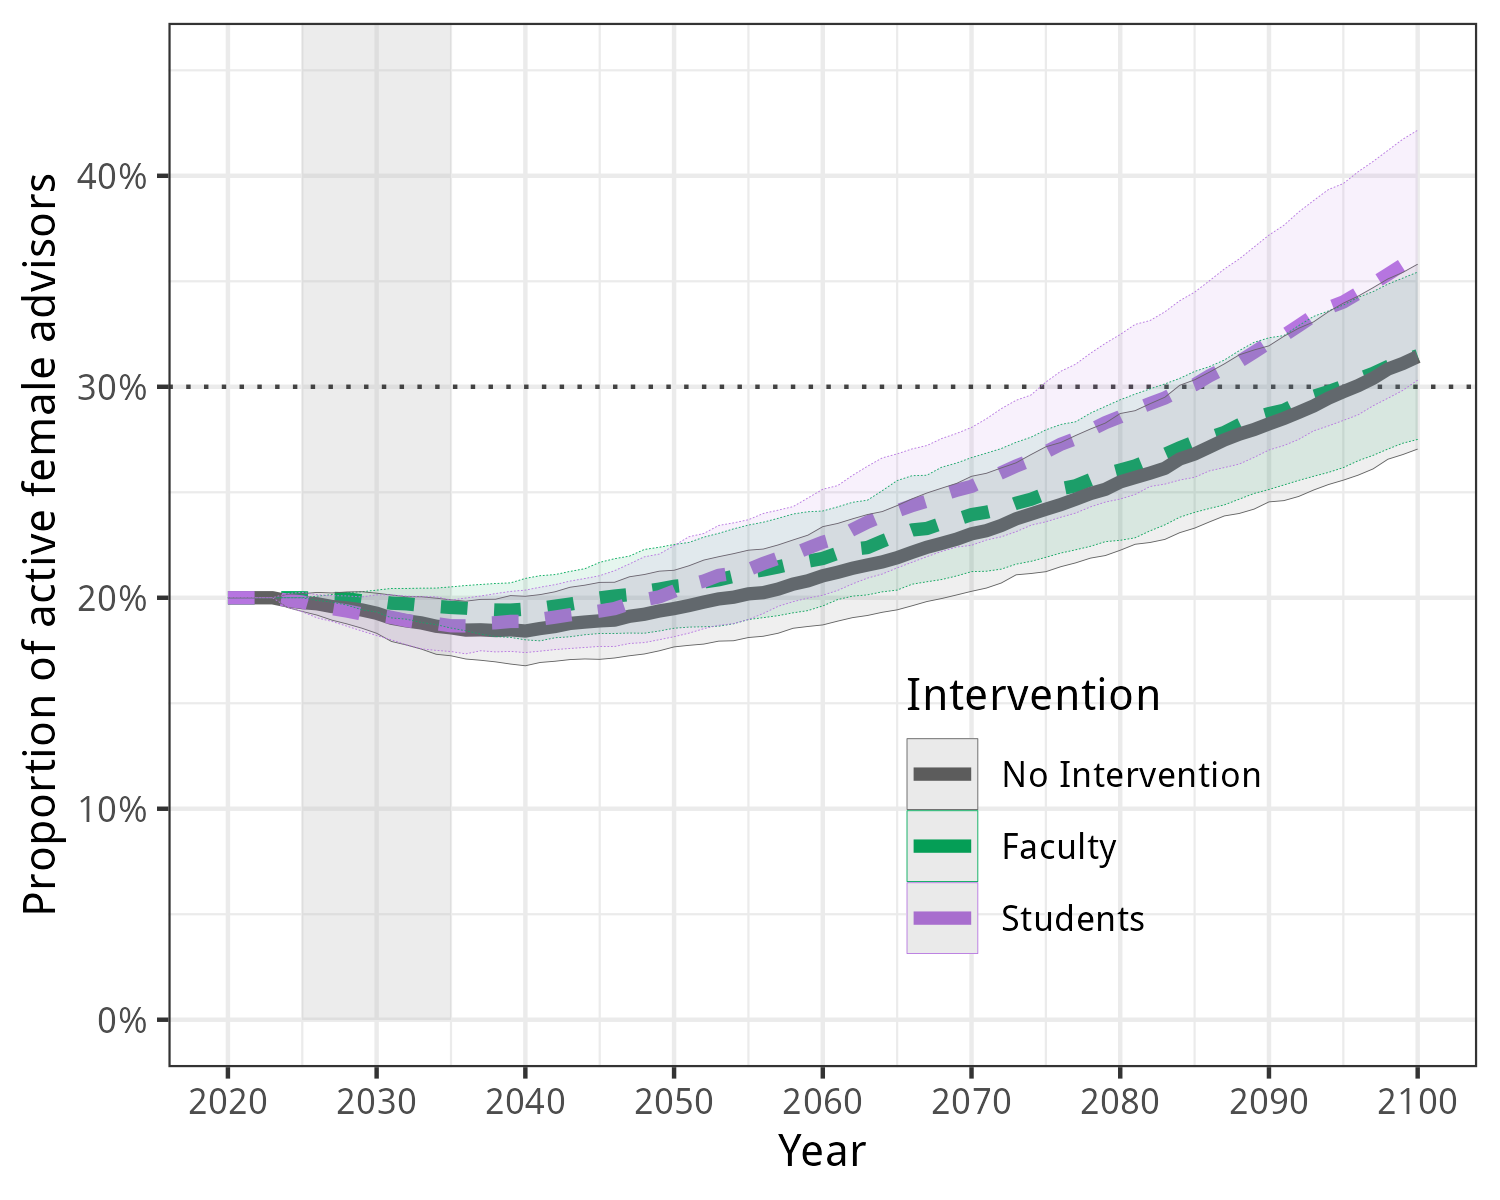
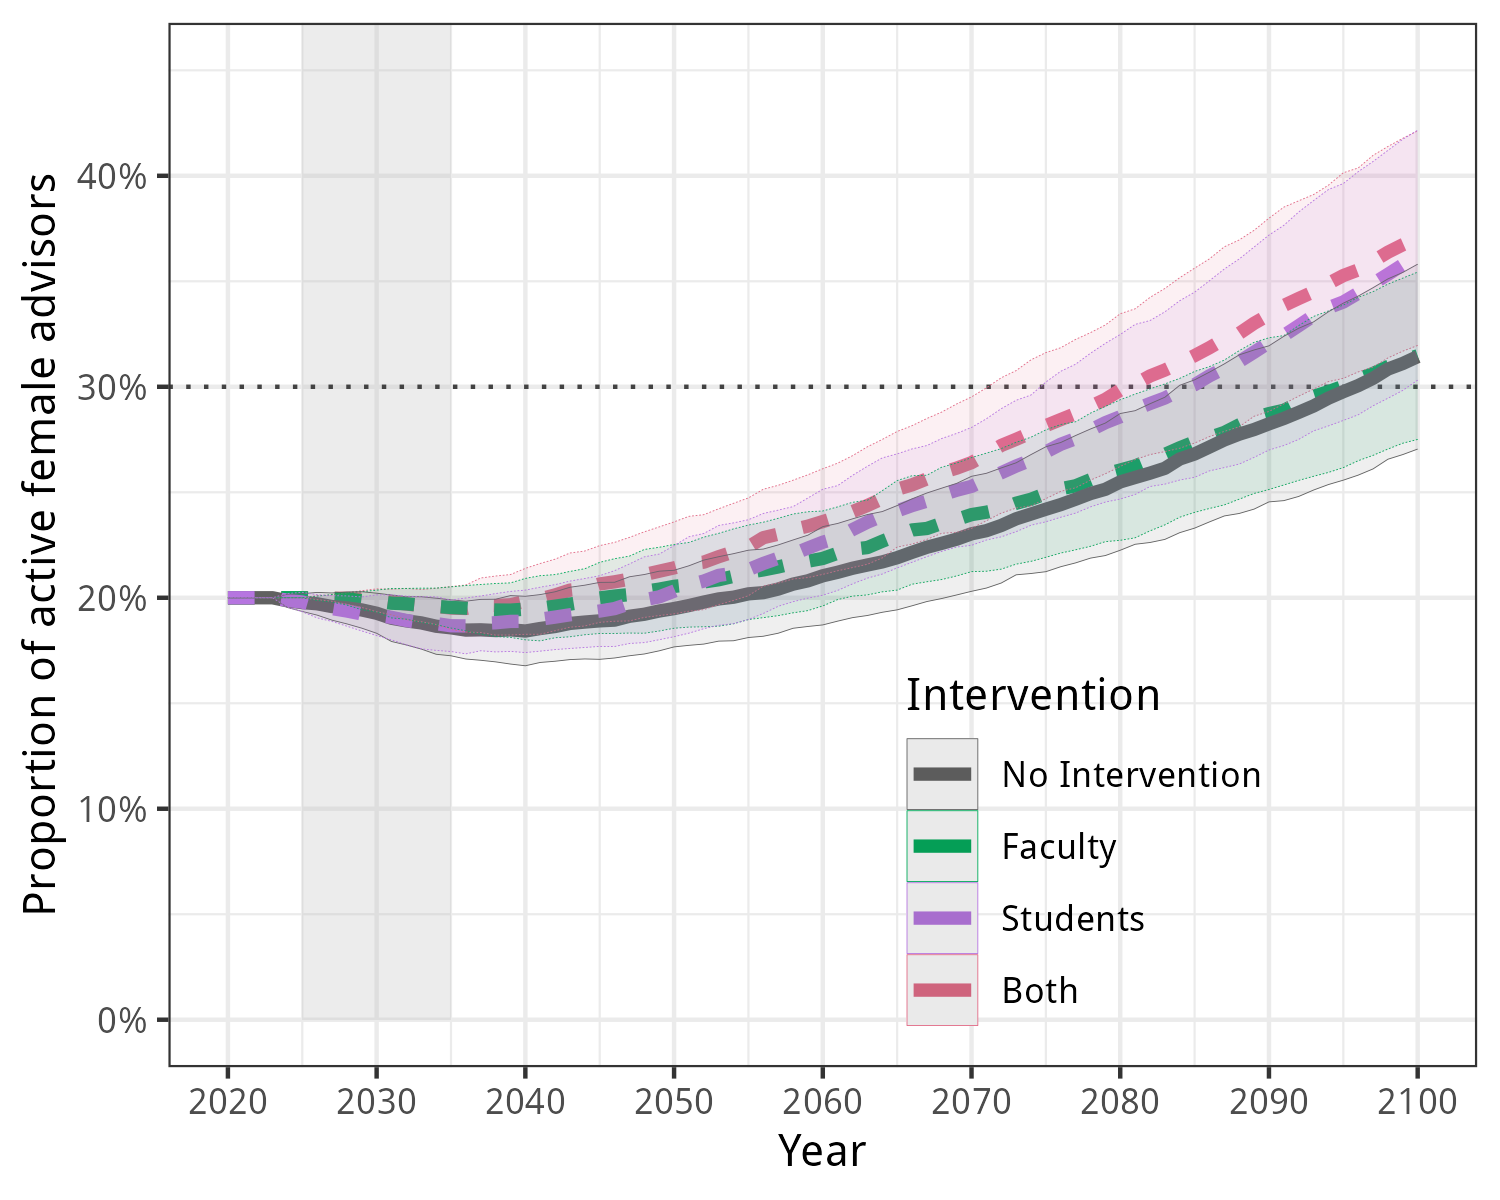
Modeling Interventions on Medium Timescales
No Intervention
Faculty Intervention
Parameters are equalized over a 10-year period for active advisors during that period.
Student Intervention
Parameters are equalized for students graduating during the intervention period and thereafter.
Both
Parameters are equalized for both active faculty and students graduating during the intervention period and thereafter.
Looking Back on Our Hypotheses
|
Mentorship: Female advisors are more effective in attracting or retaining female graduate students. |
Yes! Female advisors are ~30% more likely than male advisors to produce female PhD graduates. |
|
Belonging: Representation in the grad student community attracts women to programs and subfields. |
Yes! Subfields/advisor groups with greater representation of women tend to attract more women. |
|
Attrition:Addressing disparities in career attrition for female faculty would help to close the gender gap. |
Yes! This is an intrinsically inclusive goal AND may accelerate progress by 10-20 years. |
Thanks everyone!
|
|
Heather Brooks |
|
Harlin Lee |
|
Mason Porter |
|
|
Juan G. Restrepo |
|
Anna Haensch |
|
Ben Brill |
|
|
National Science Foundation |

|
ICERM @Brown |
Preprint coming soon 😬😬😬